Click the images for a larger view.
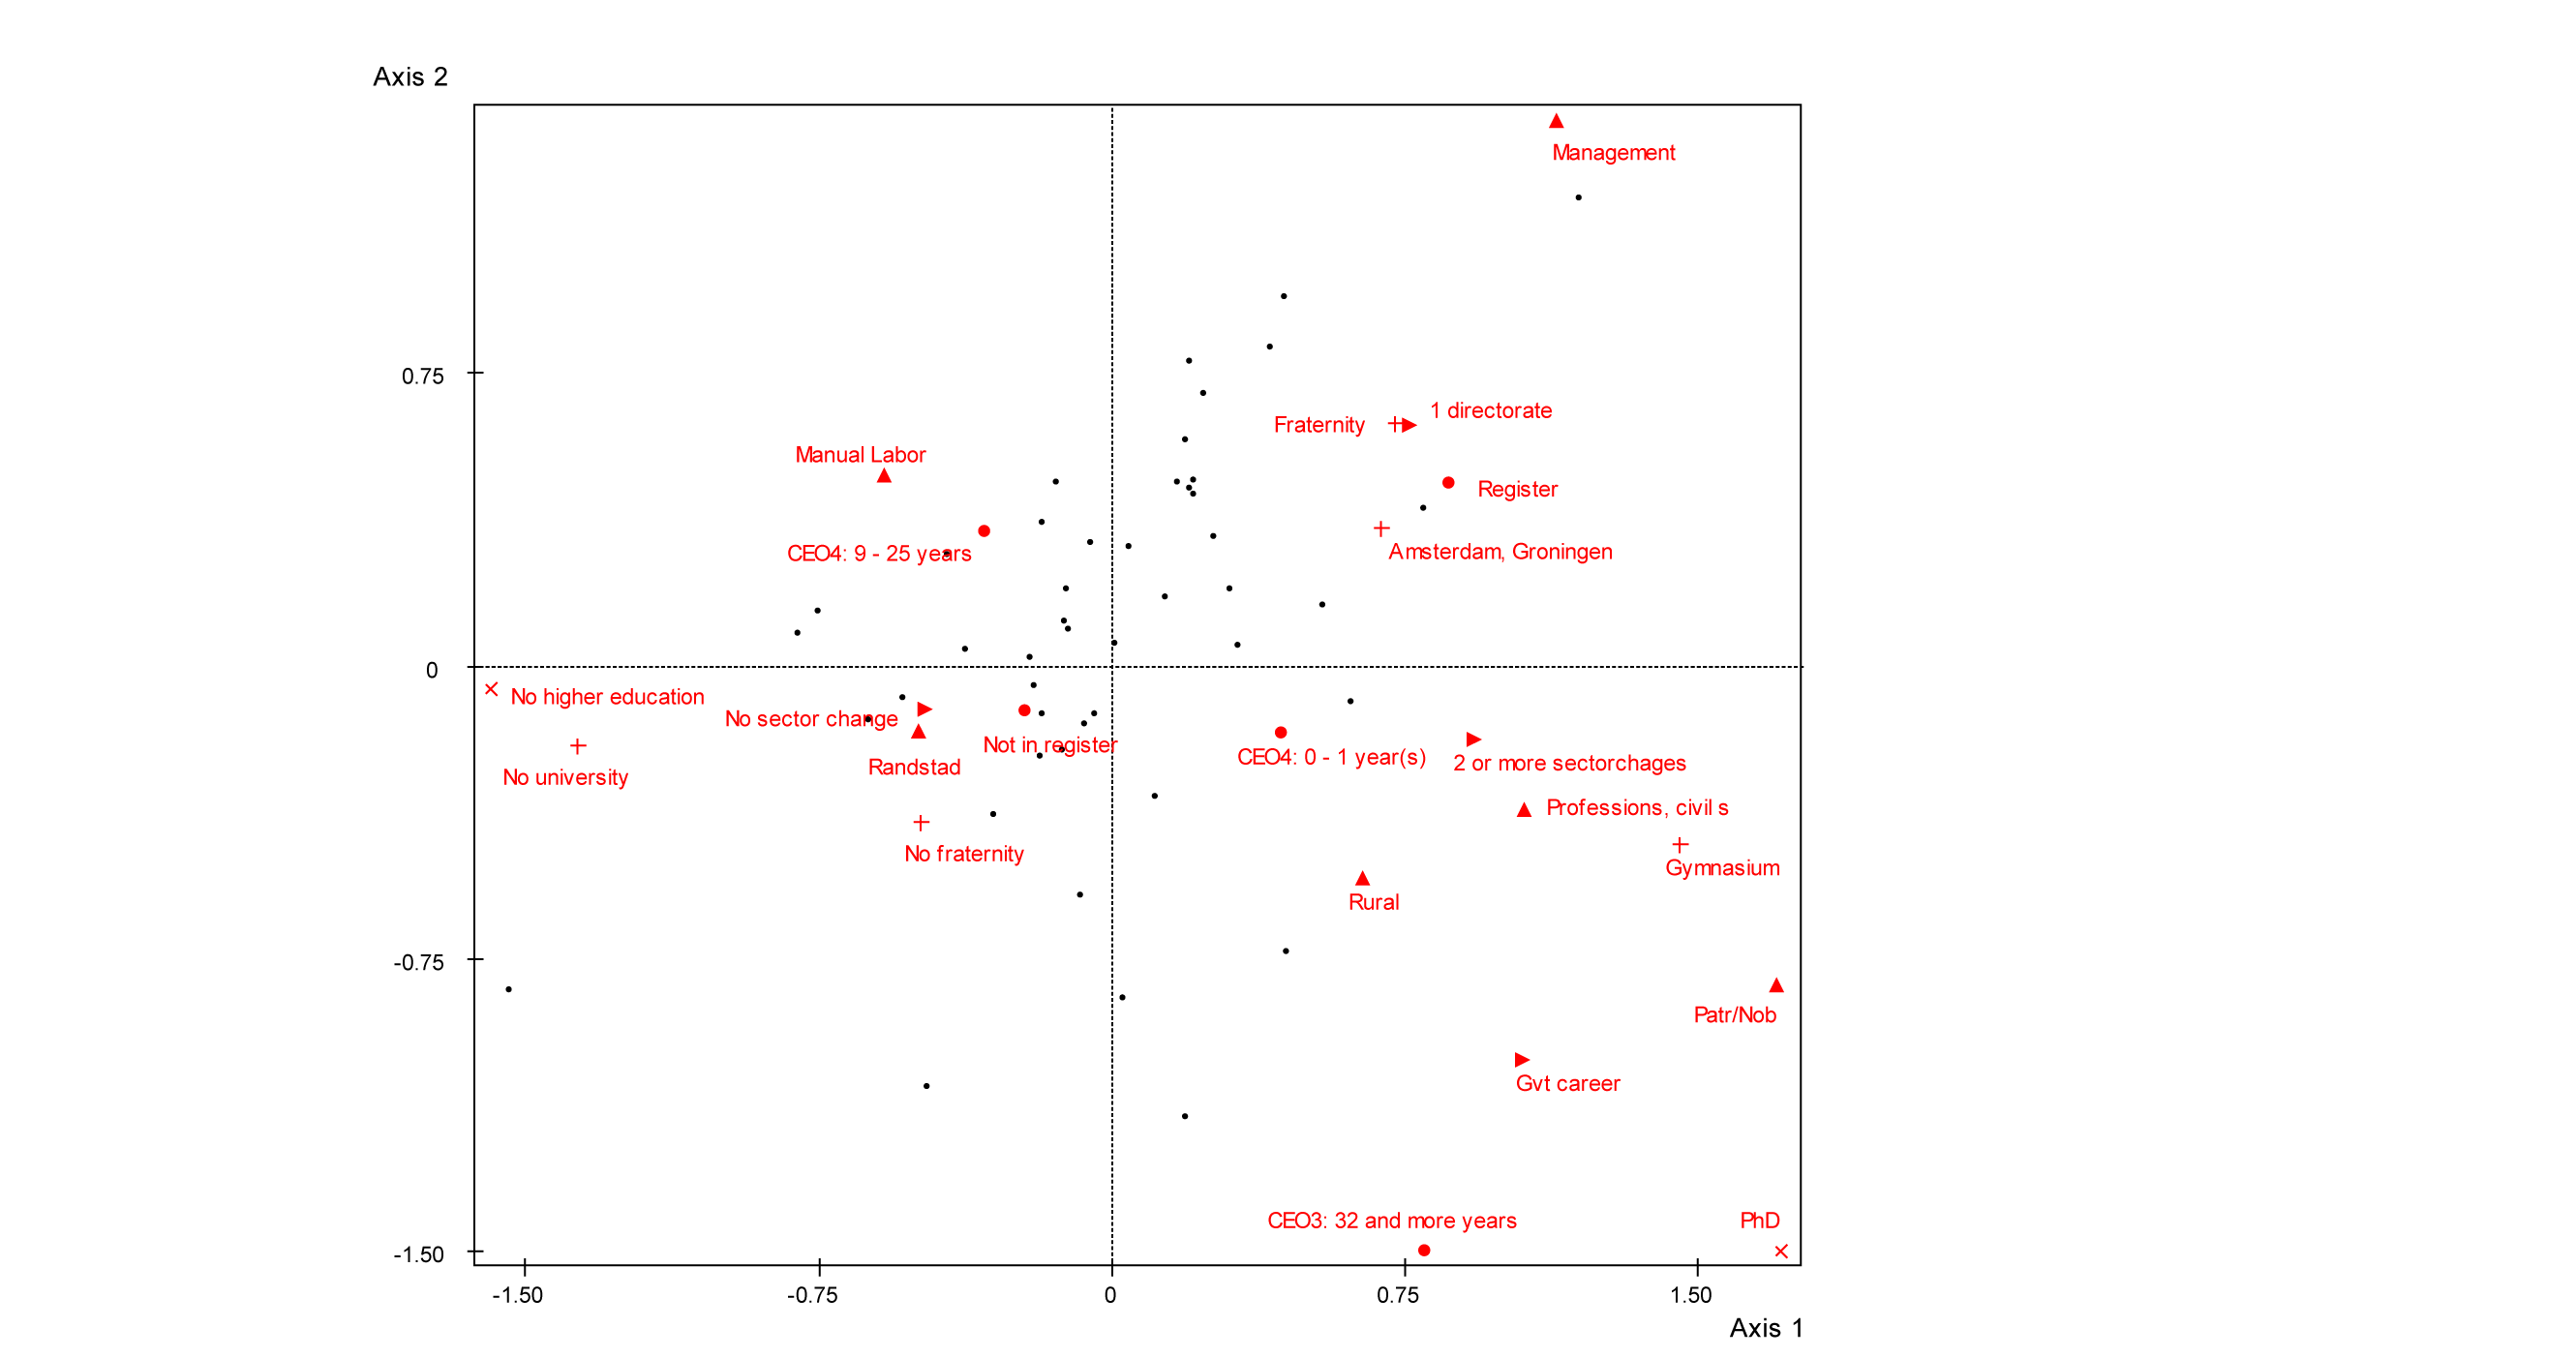
Figure 6.1
Plane of axes 1 and 2.Only the modalities with an above average contribution to axis 1 are shown.
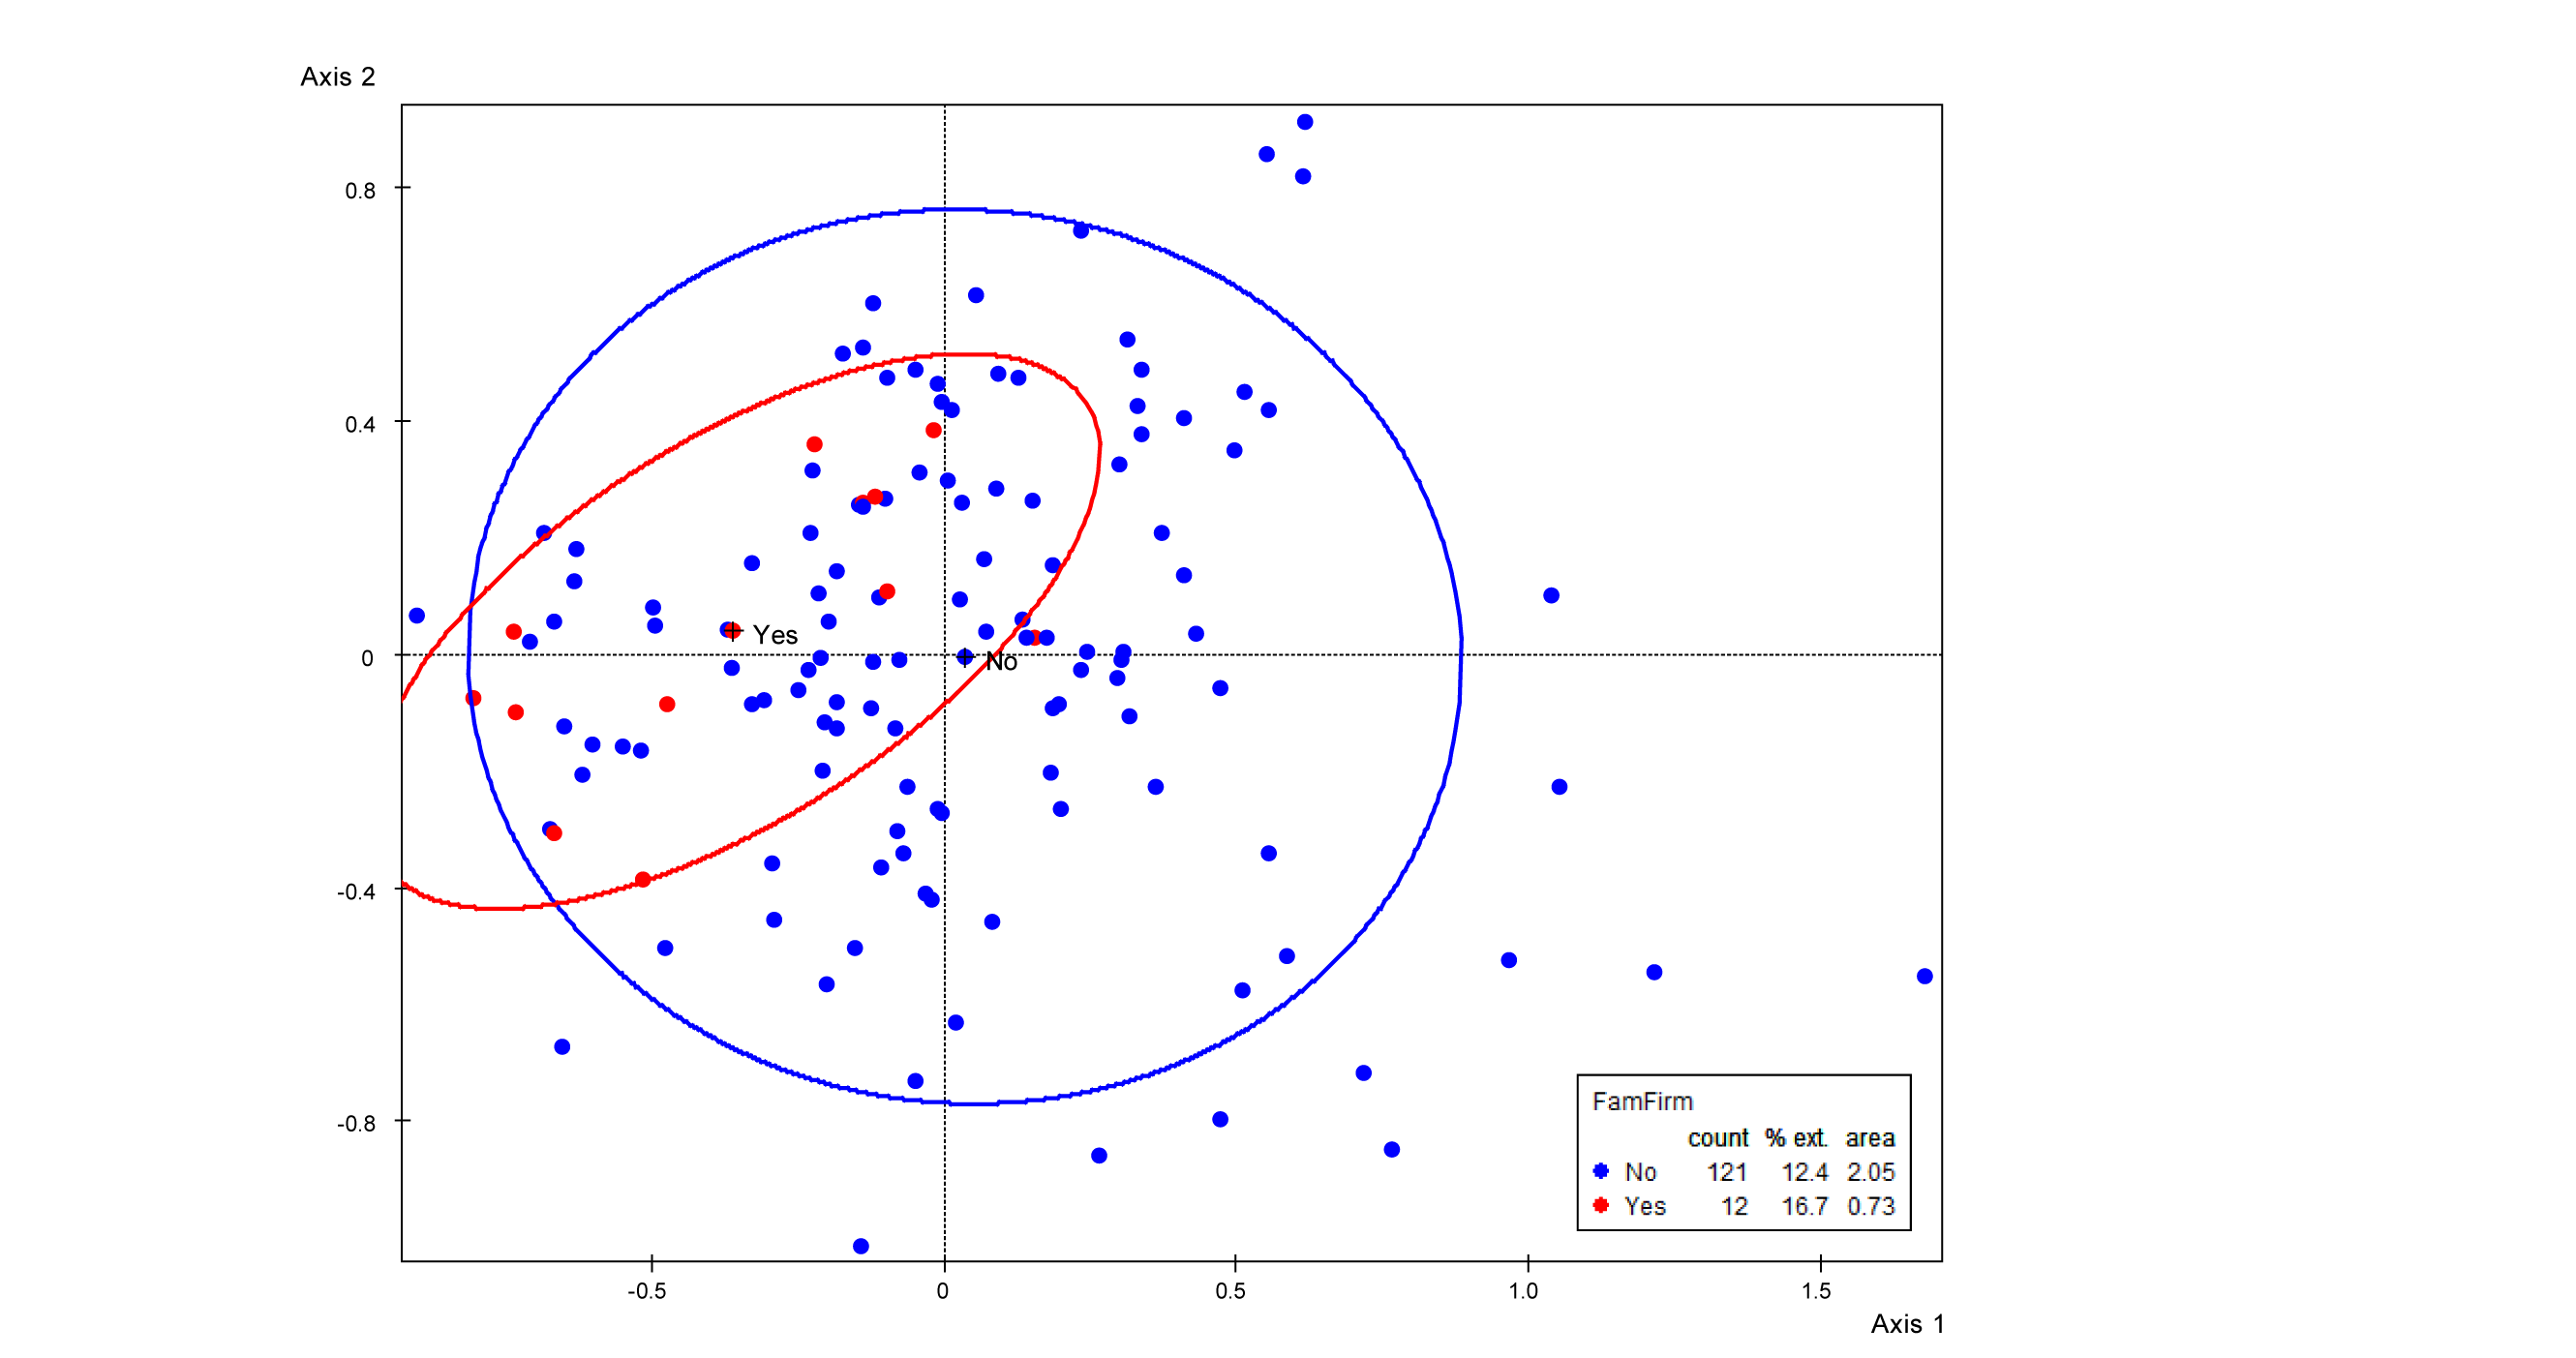
Figure 6.2
Concentration ellipses of the CEOs of firms owned by themselves or their families and the CEOs of other firms in the plane of axes 1 and 2.
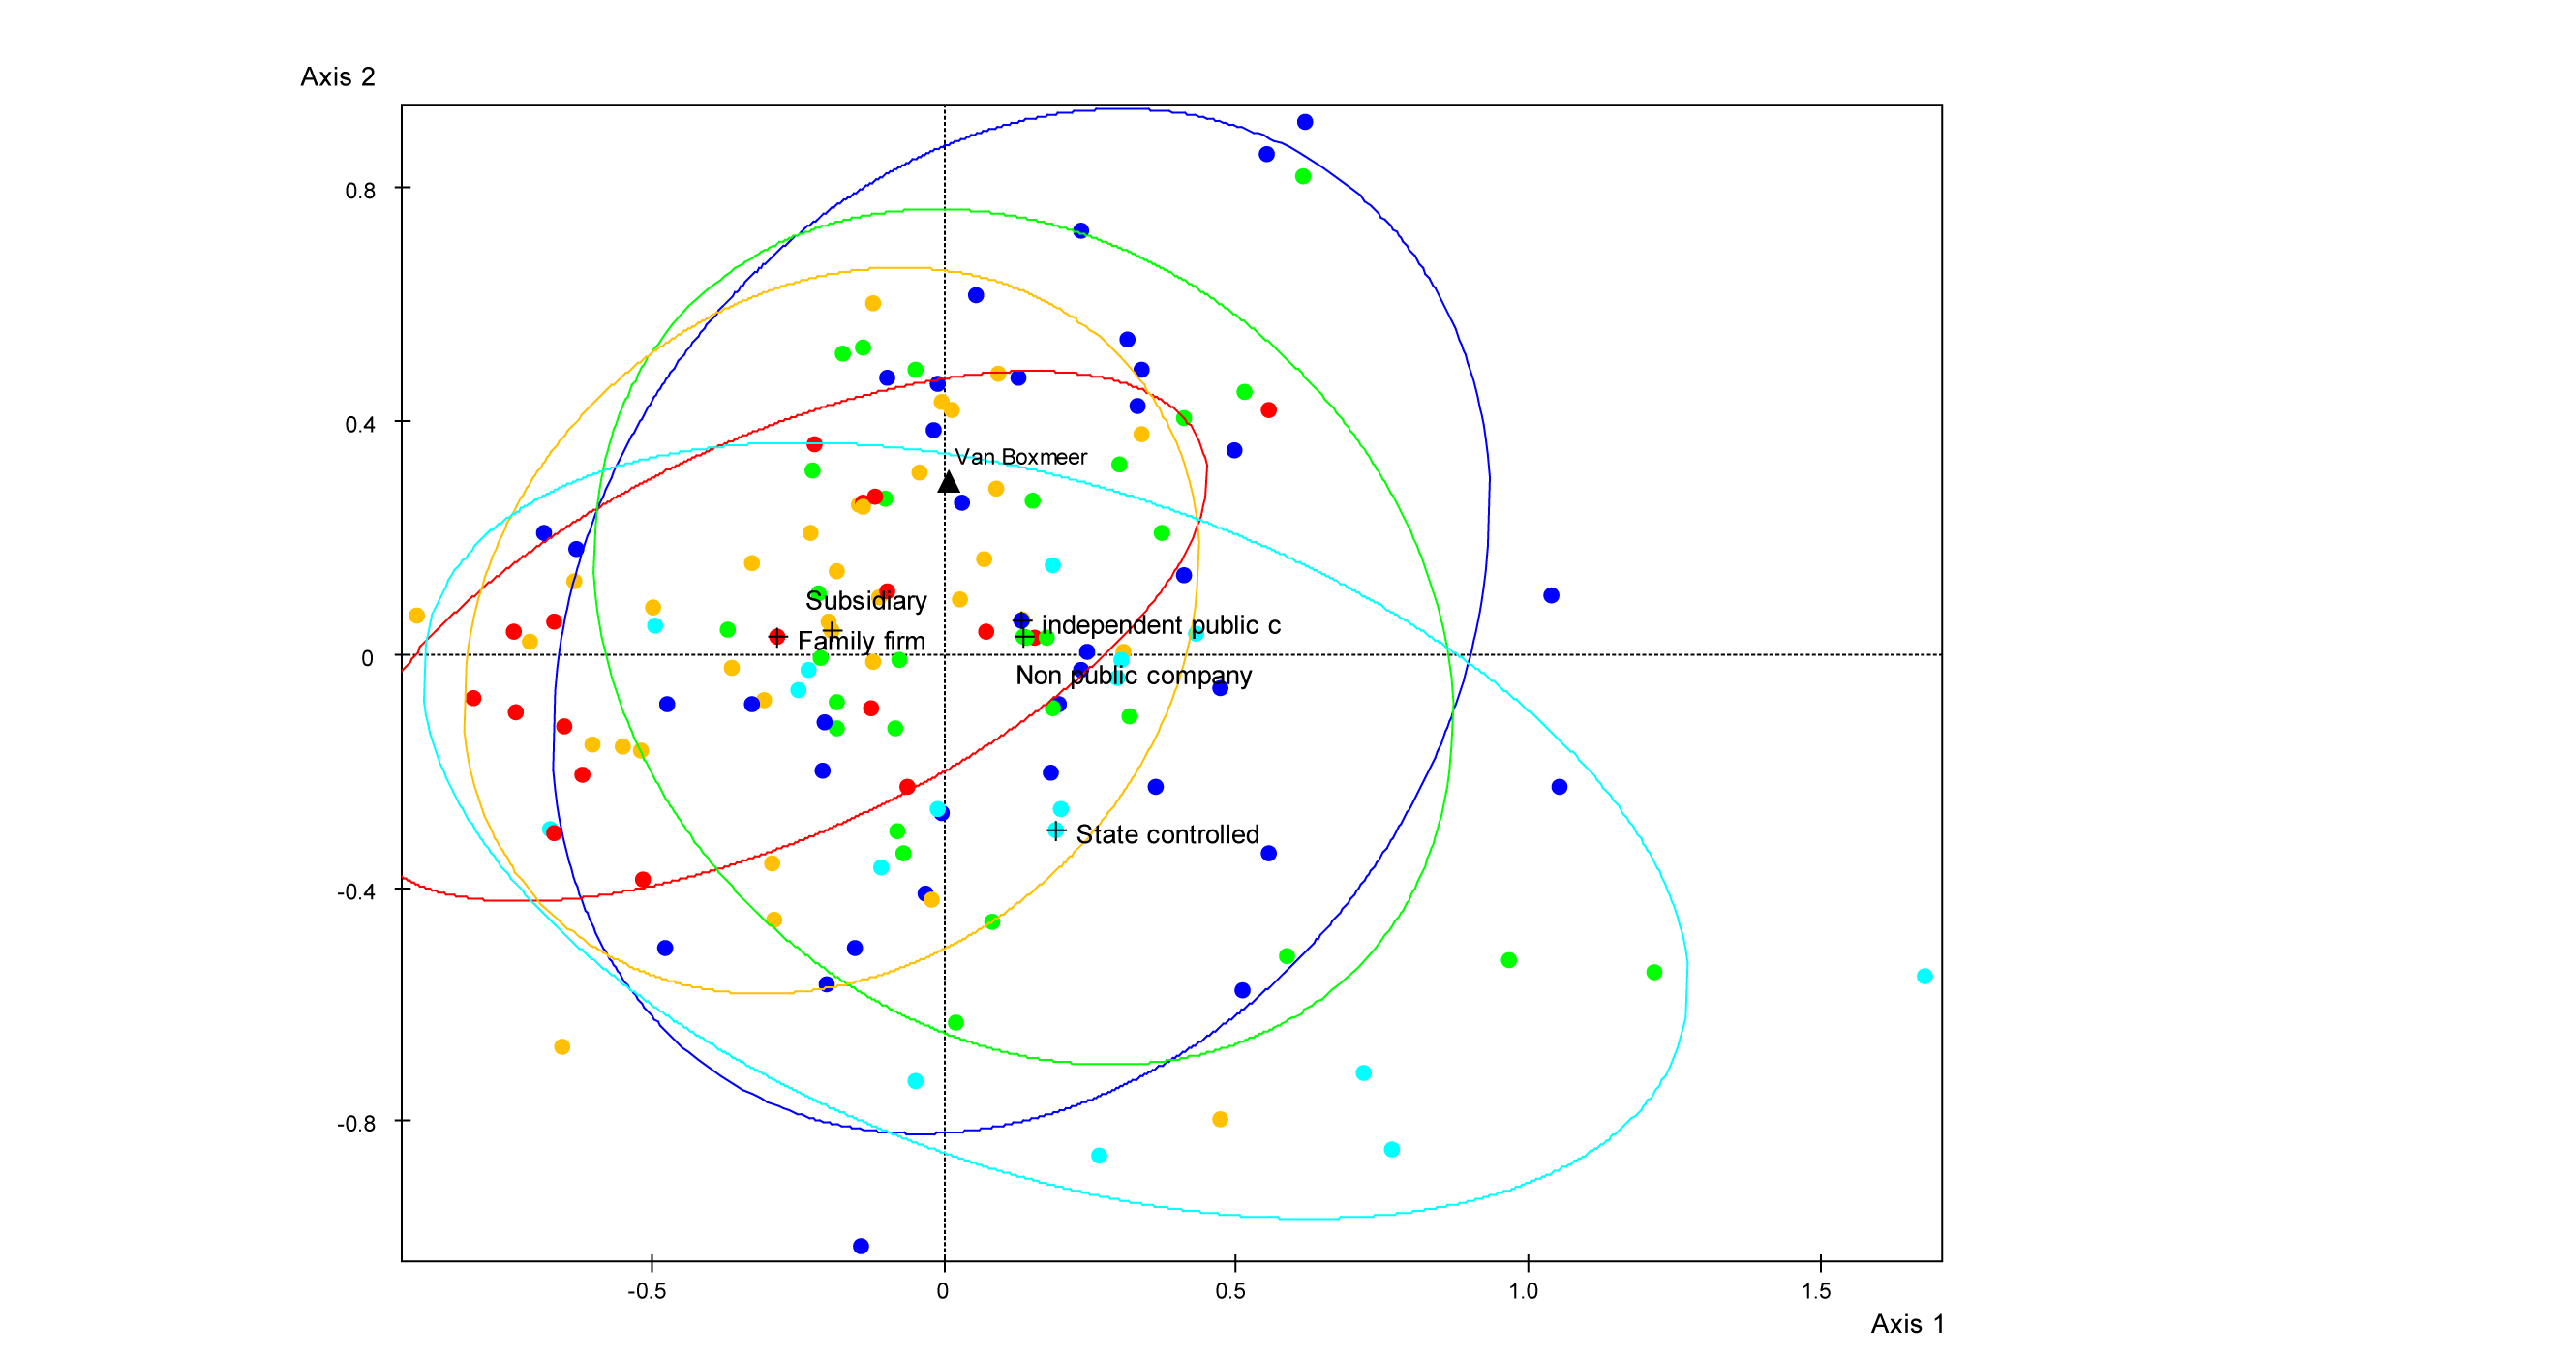
Figure 6.3
Concentration ellipses of the CEOs of 5 different types of firms in the plane of axes 1 and 2. Heineken CEO Van Boxmeer appears on the north side of the second axis.
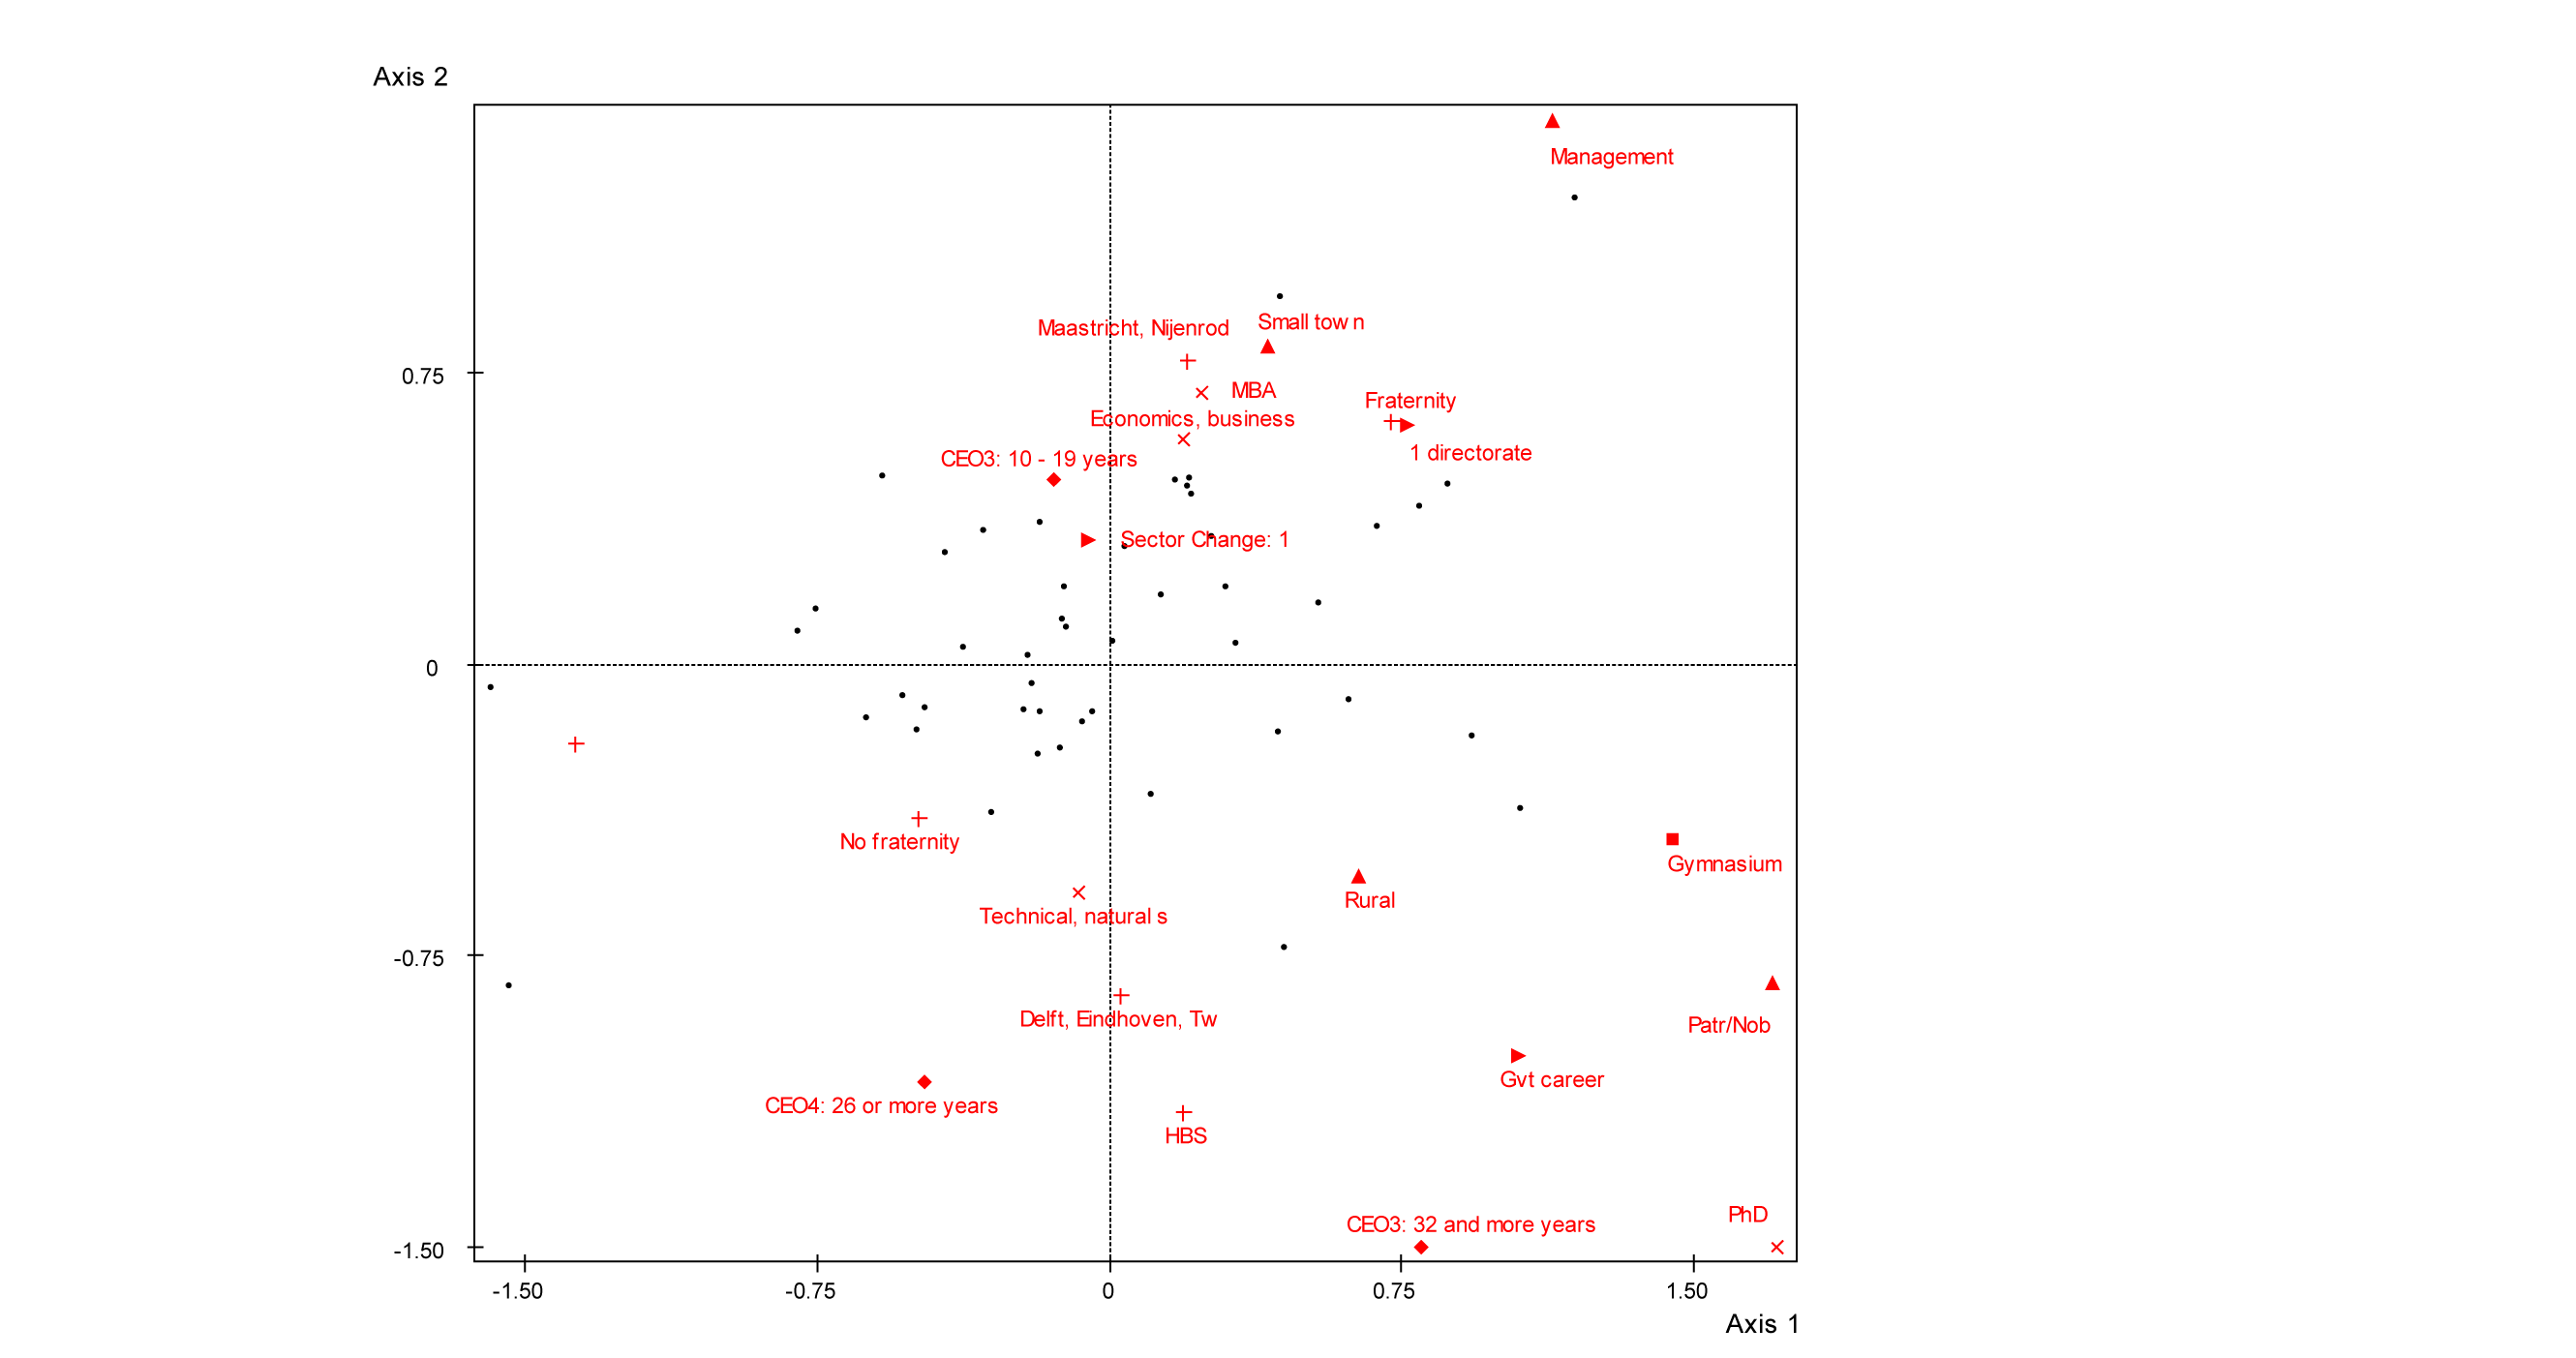
Figure 6.4
Plane of axes 1 and 2. Only the modalities with an above average contribution to axis 2 are shown.
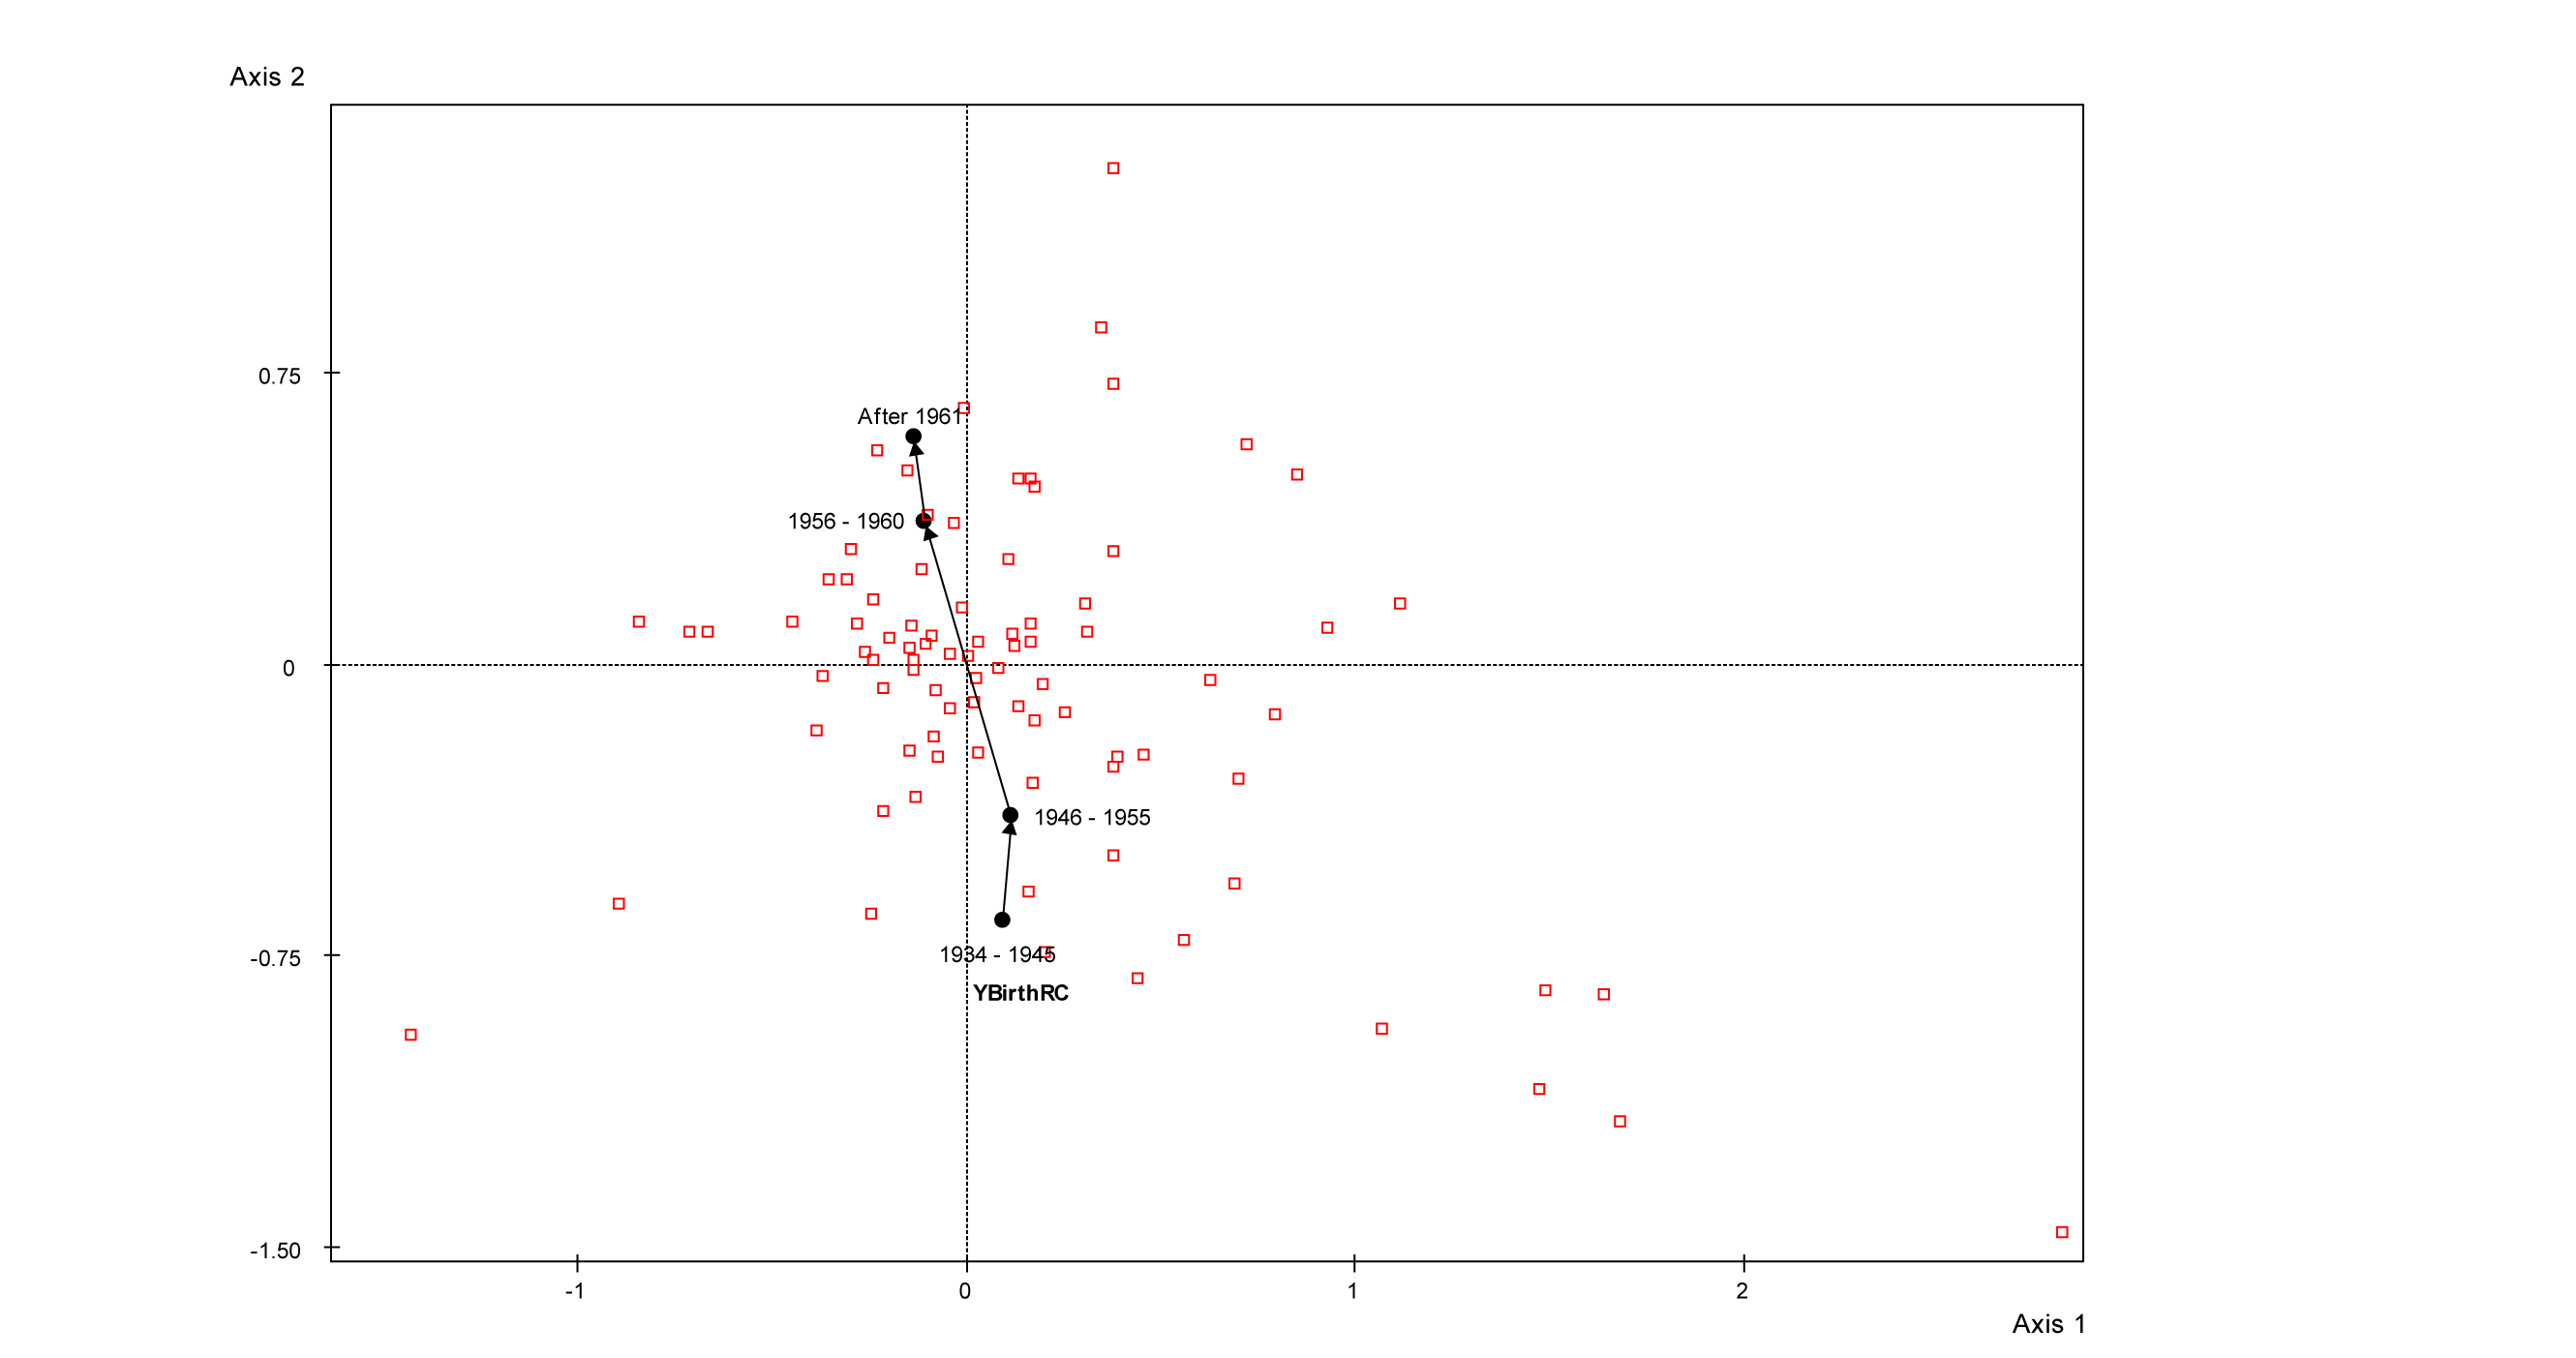
Figure 6.5a
Trajectory of the supplementary variable Year of birth (YBirthRC) in the space of modalities, plane of axes 1 and 2.
From bottom to top: Born in 1934 – 1945; 1946 – 1955; 1956 – 1960; After 1961.
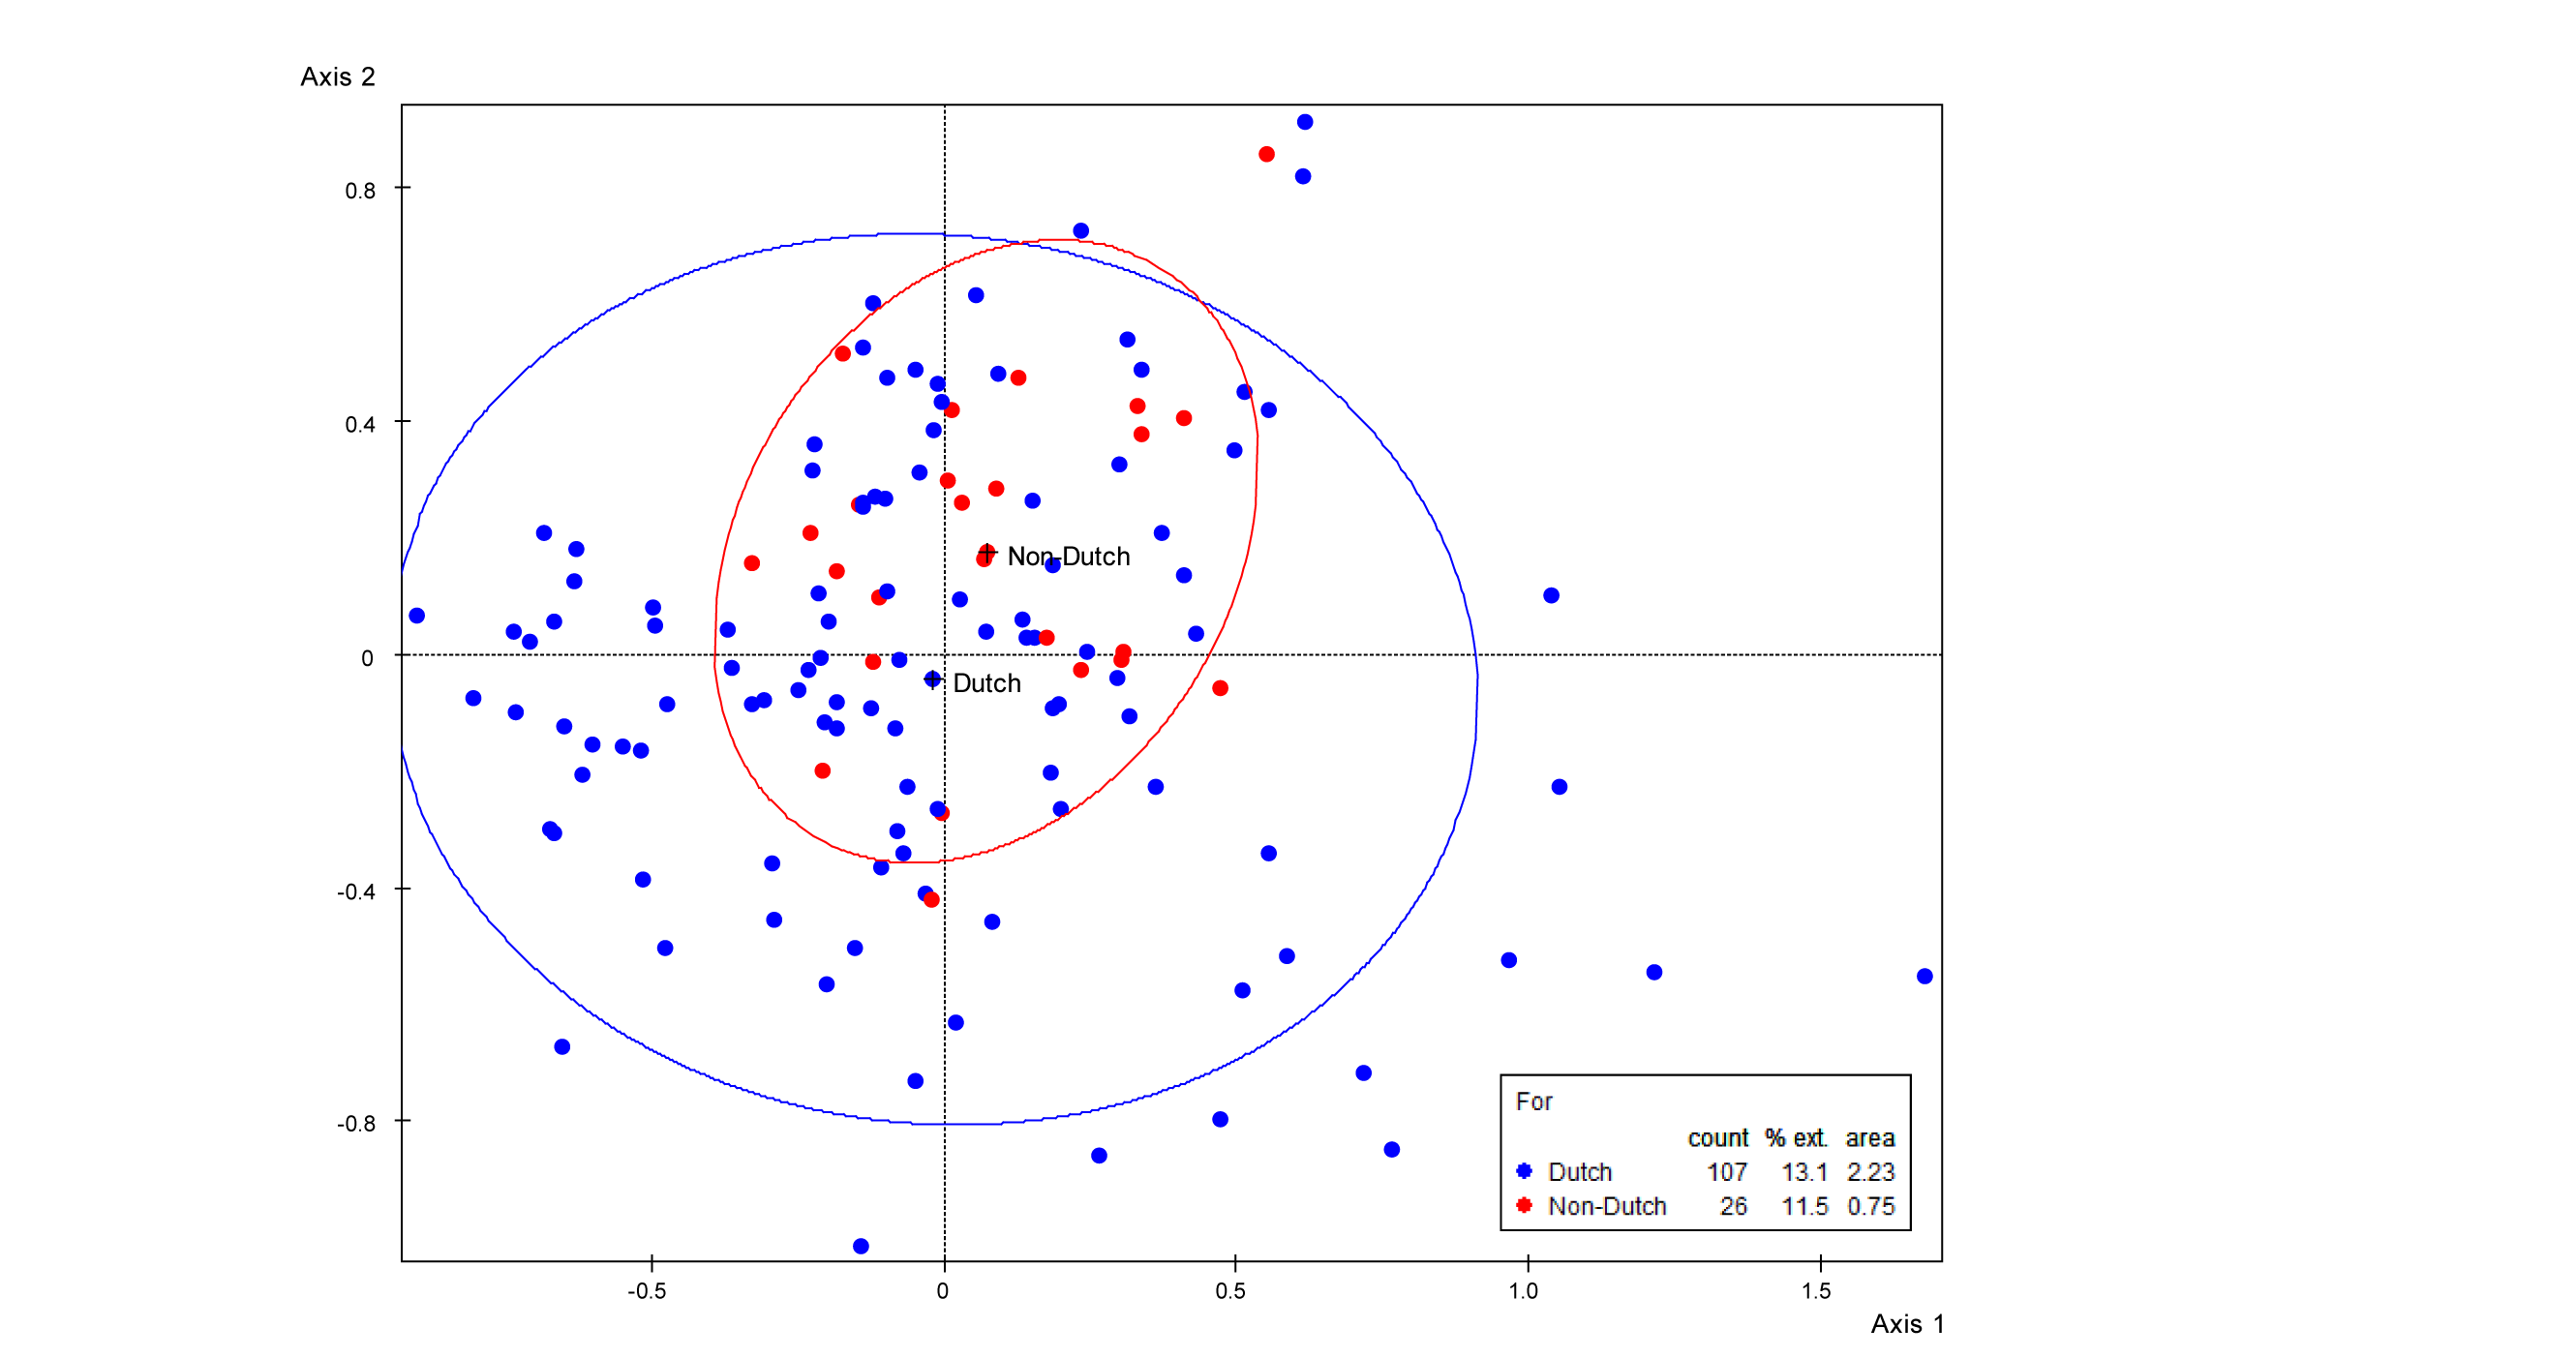
Figure 6.5b
Concentration ellipses of the Dutch and non-Dutch CEOs. Plane of axes 1 and 2.
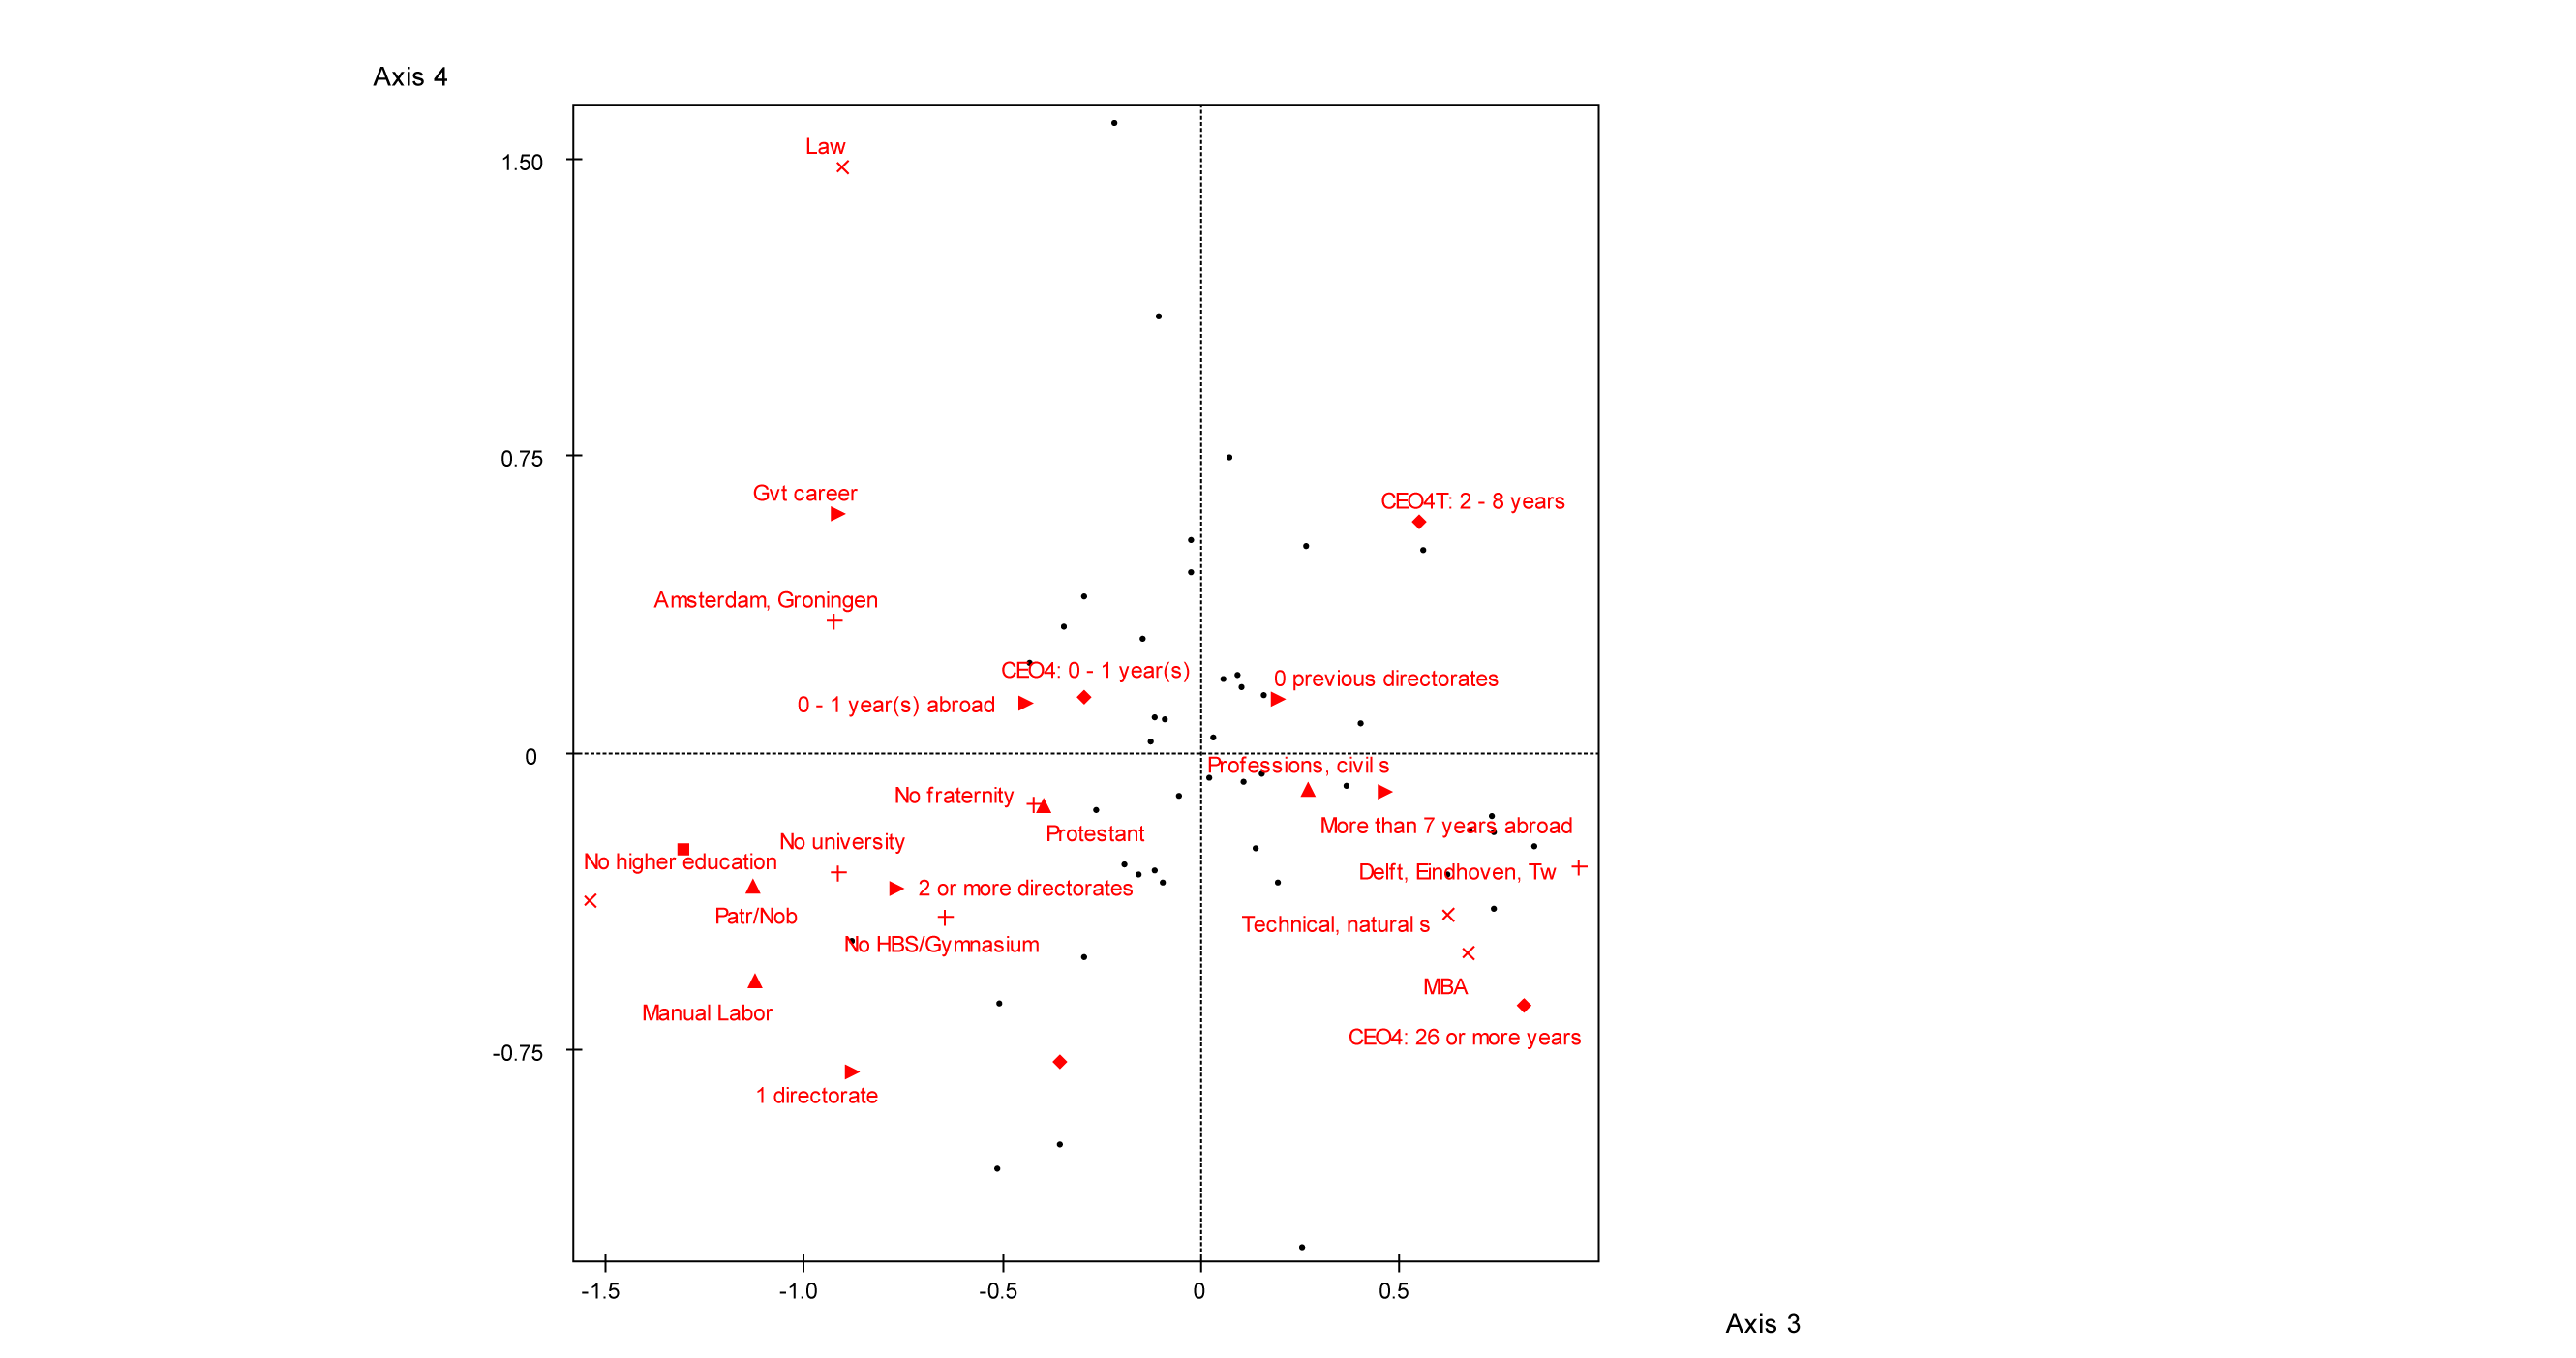
Figure 6.6
Plane of axes 3 and 4. Only the modalities with an above average contribution to axis 3 are shown (see Table 6.5).
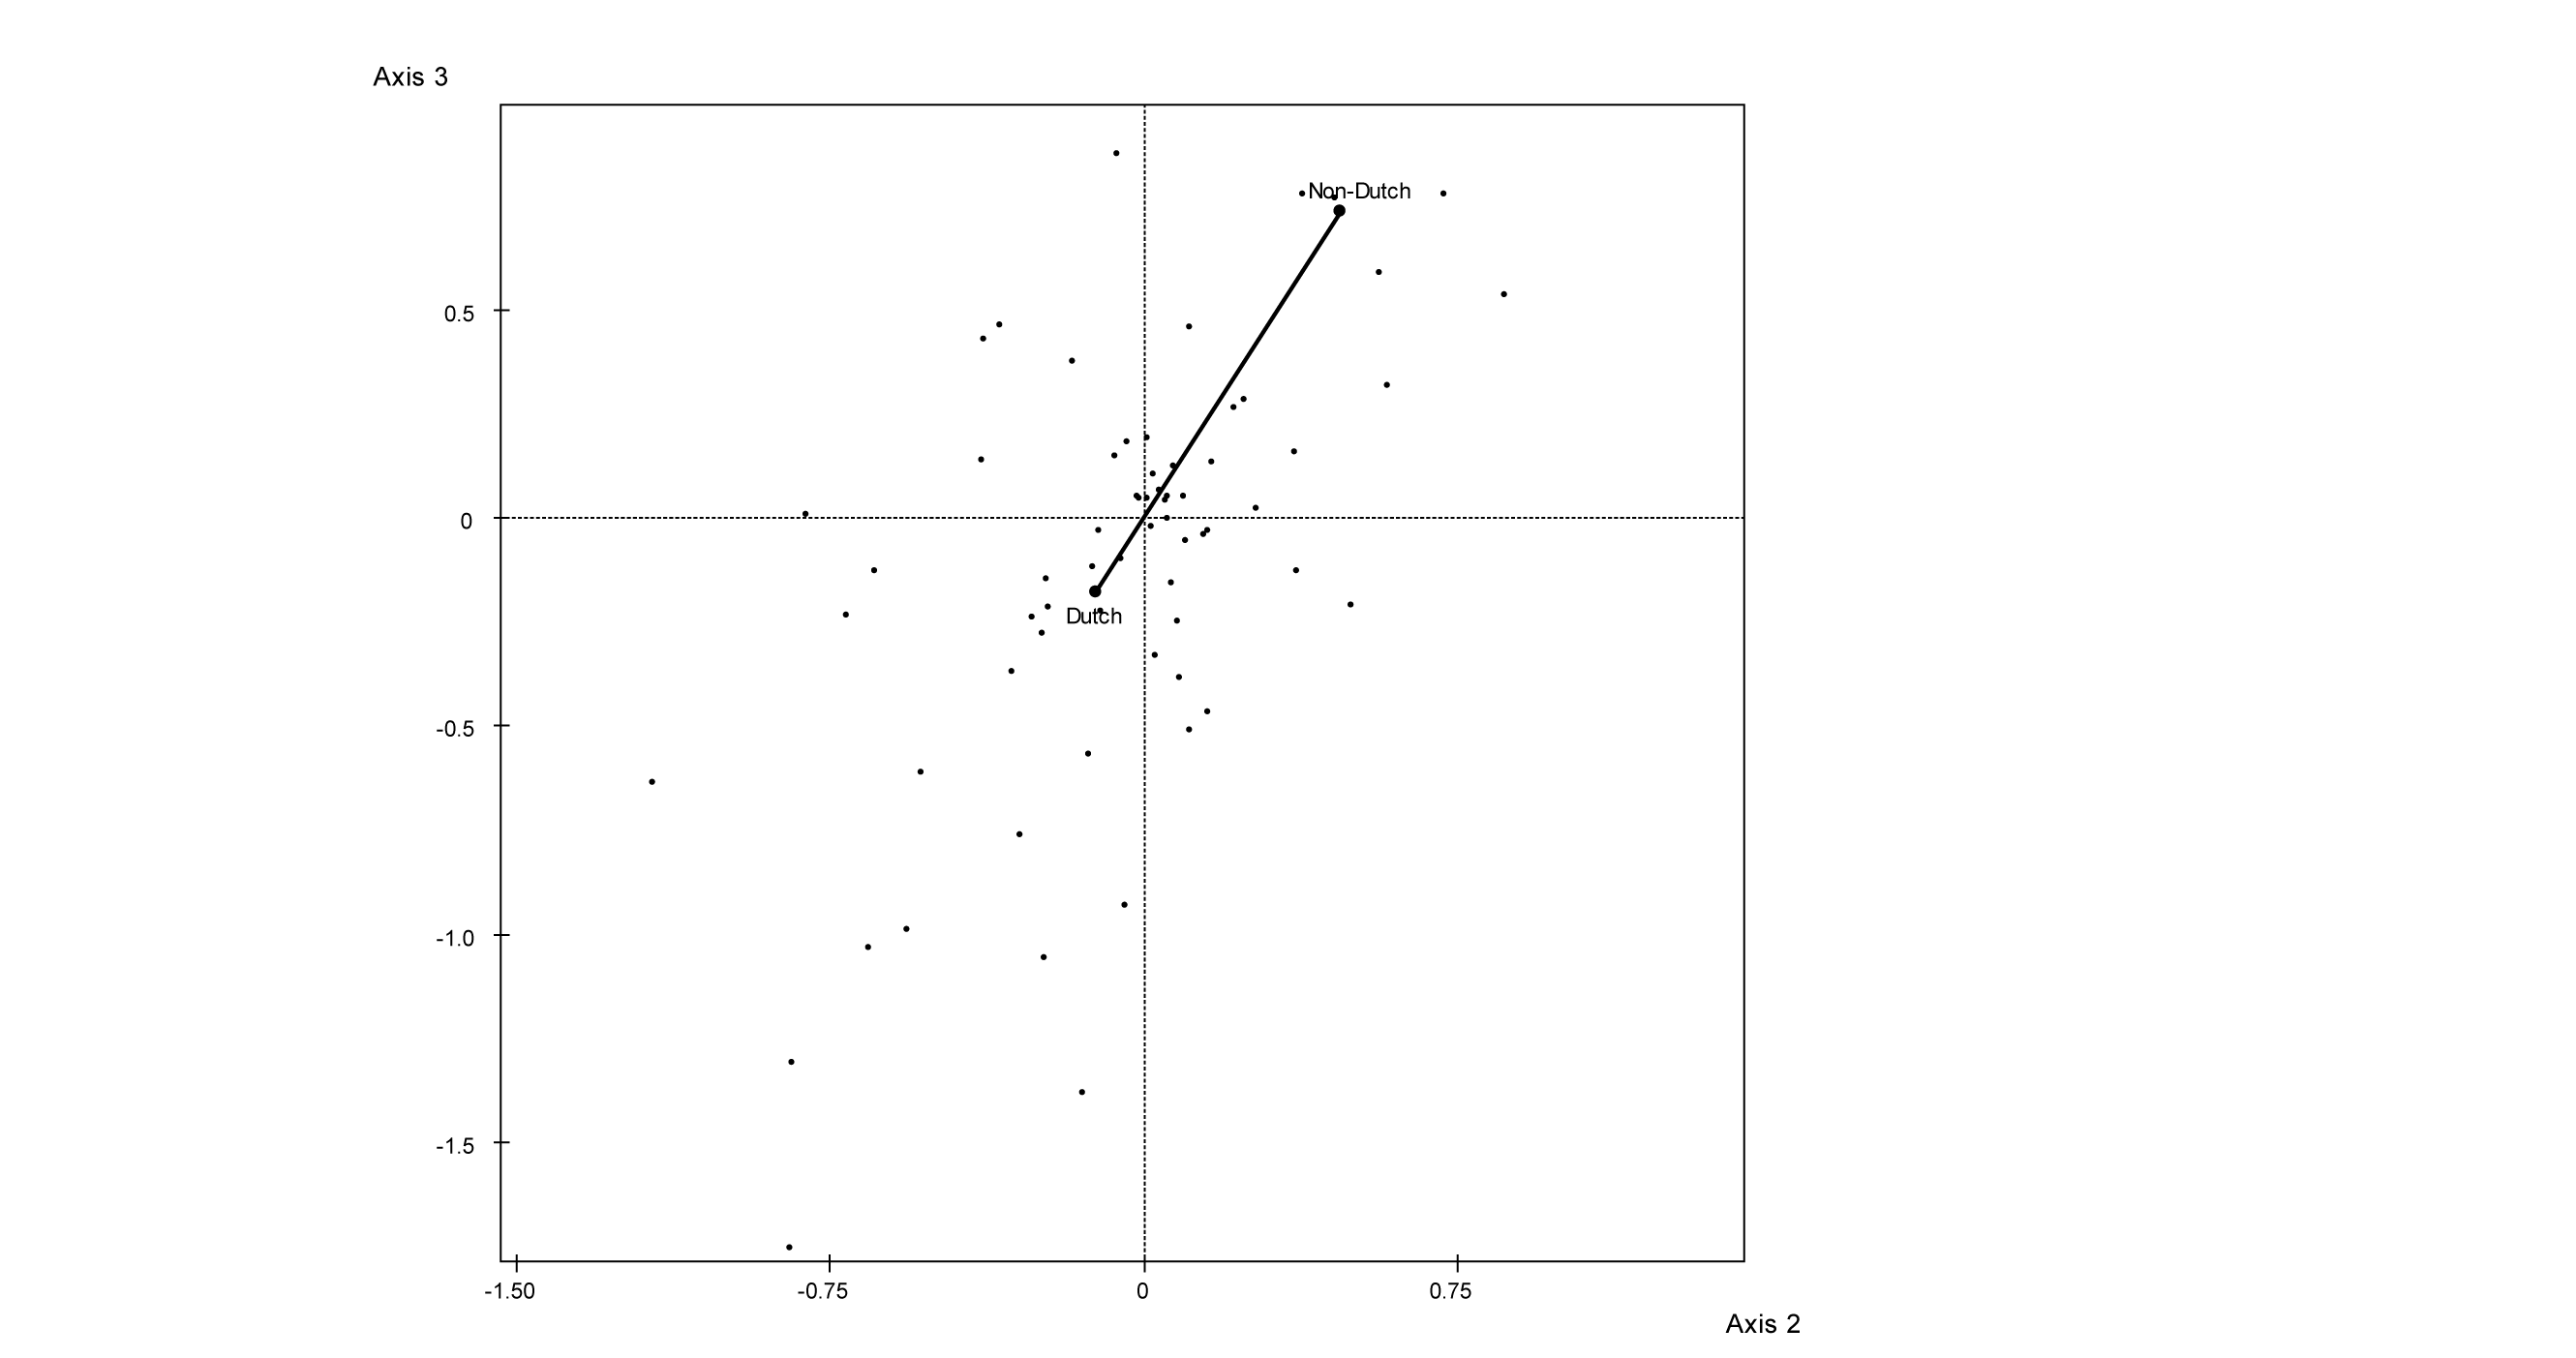
Figure 6.7a
Vector displaying the main effect of the supplementary variable For in the space of modalities, plane of axes 2 and 3.
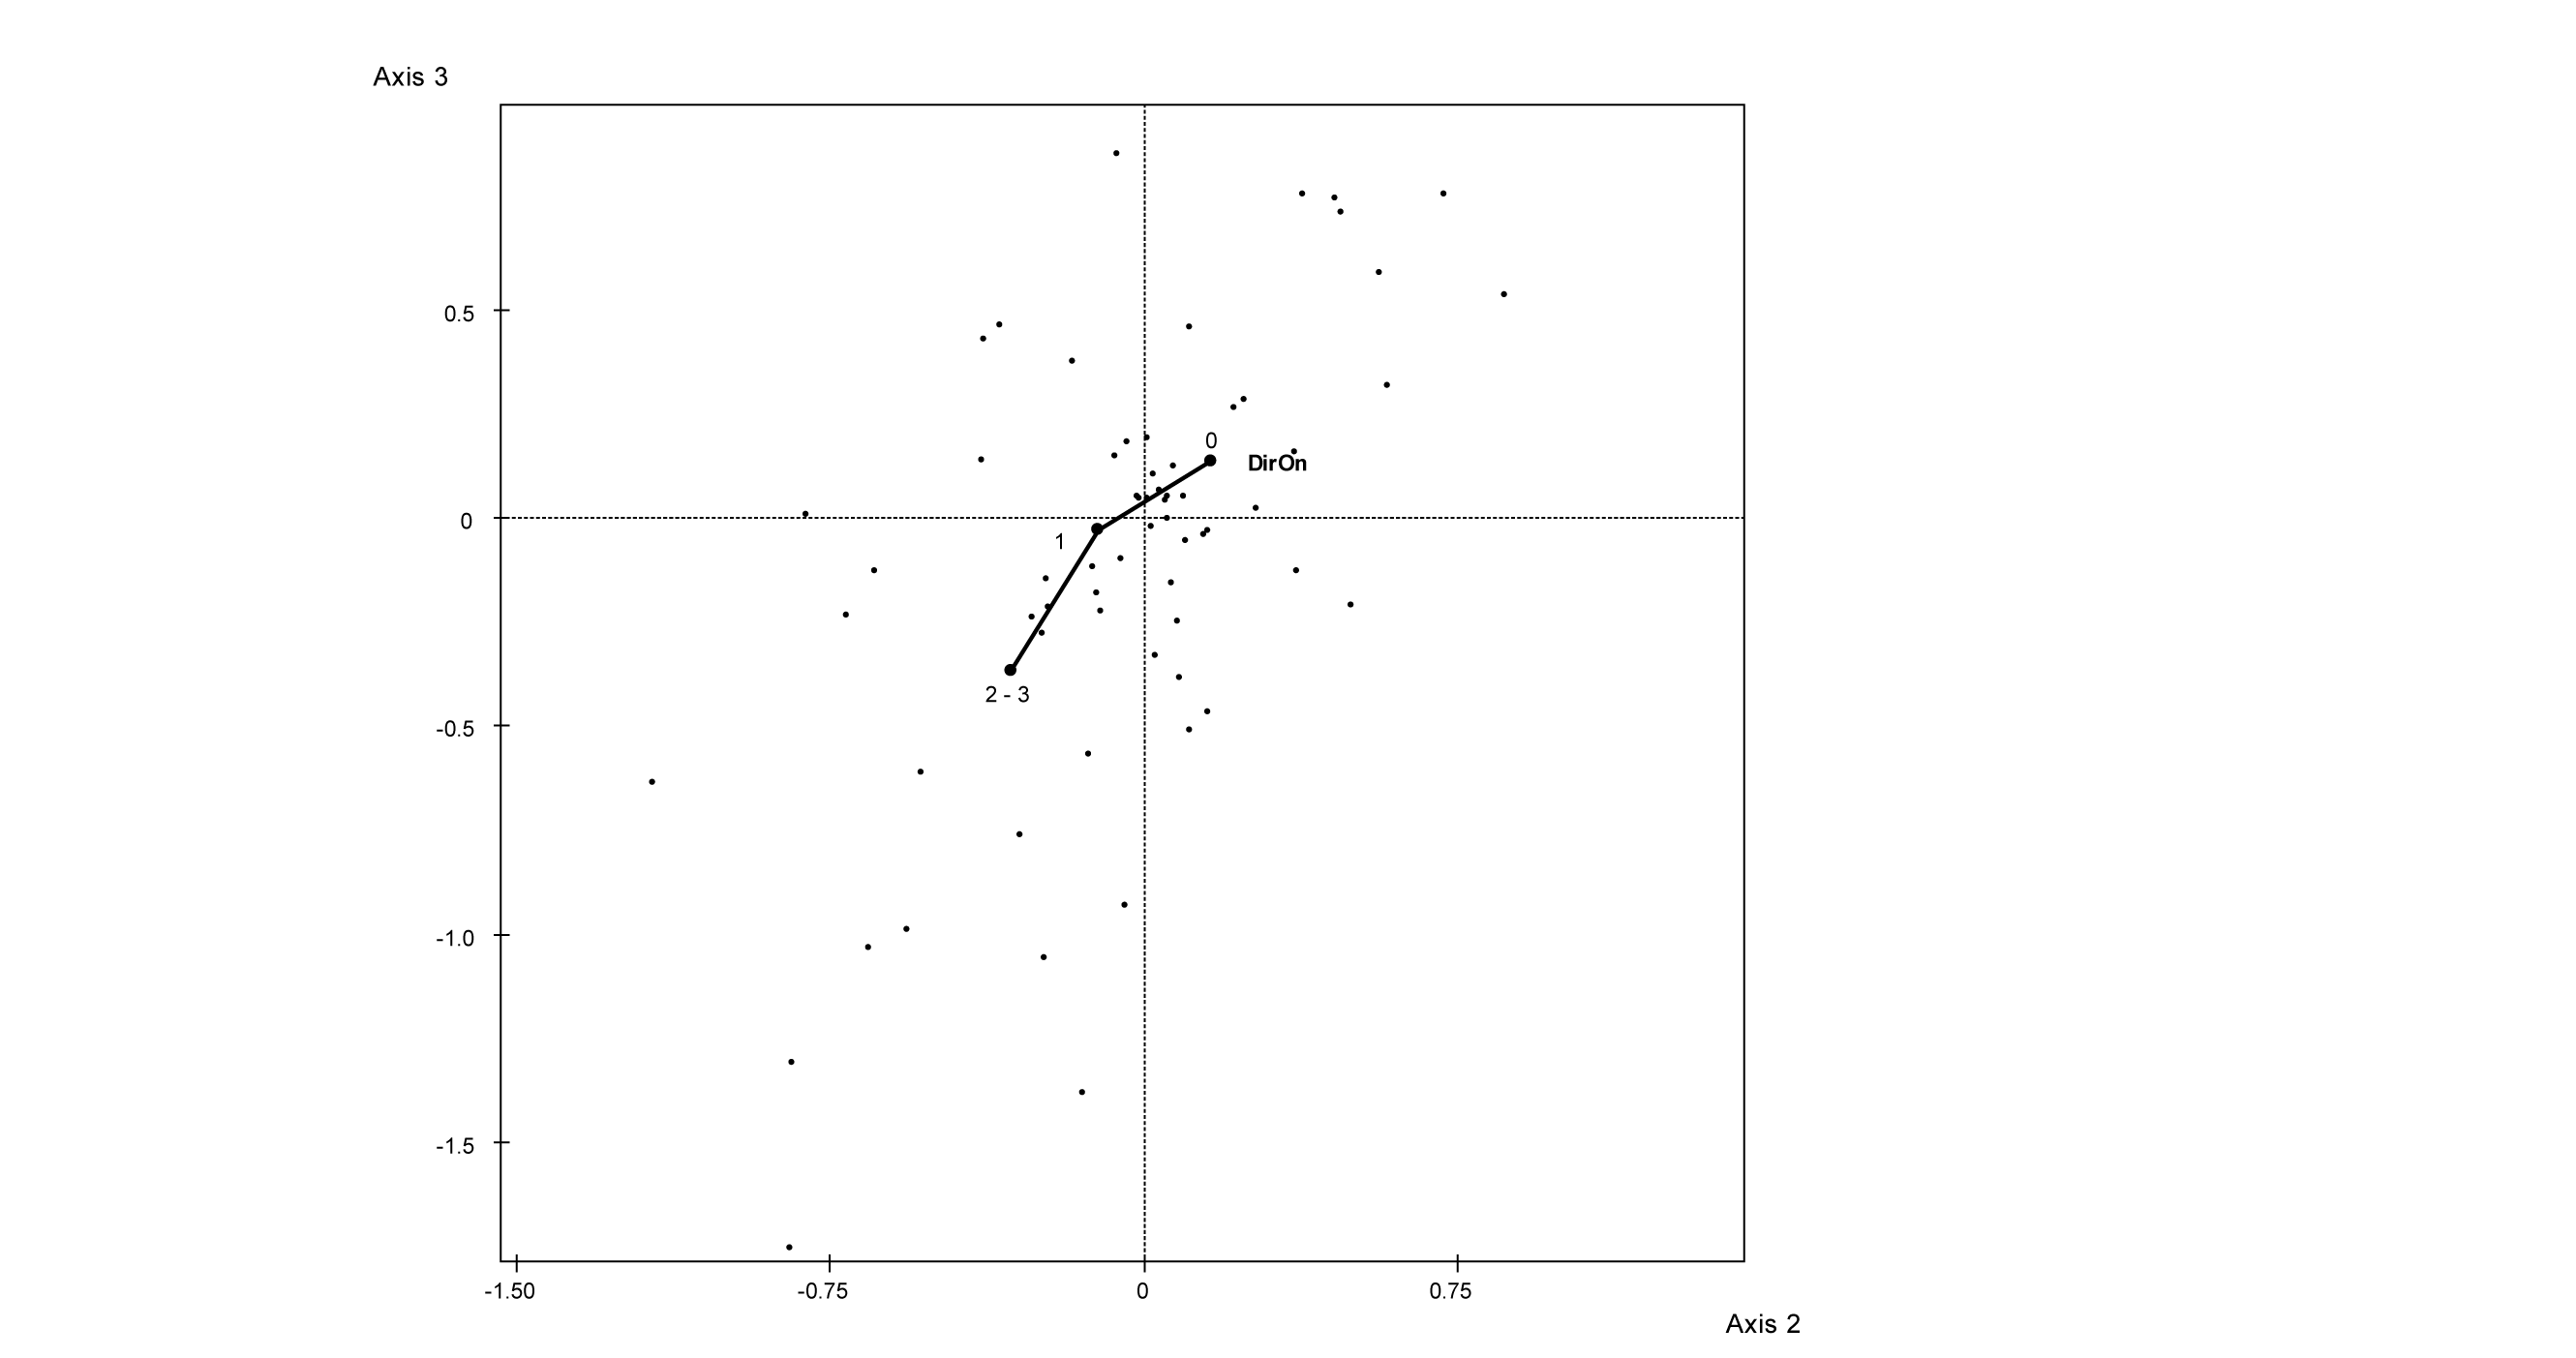
Figure 6.7b
Vectors displaying the main effects of the supplementary variable DirOn in the same plane.
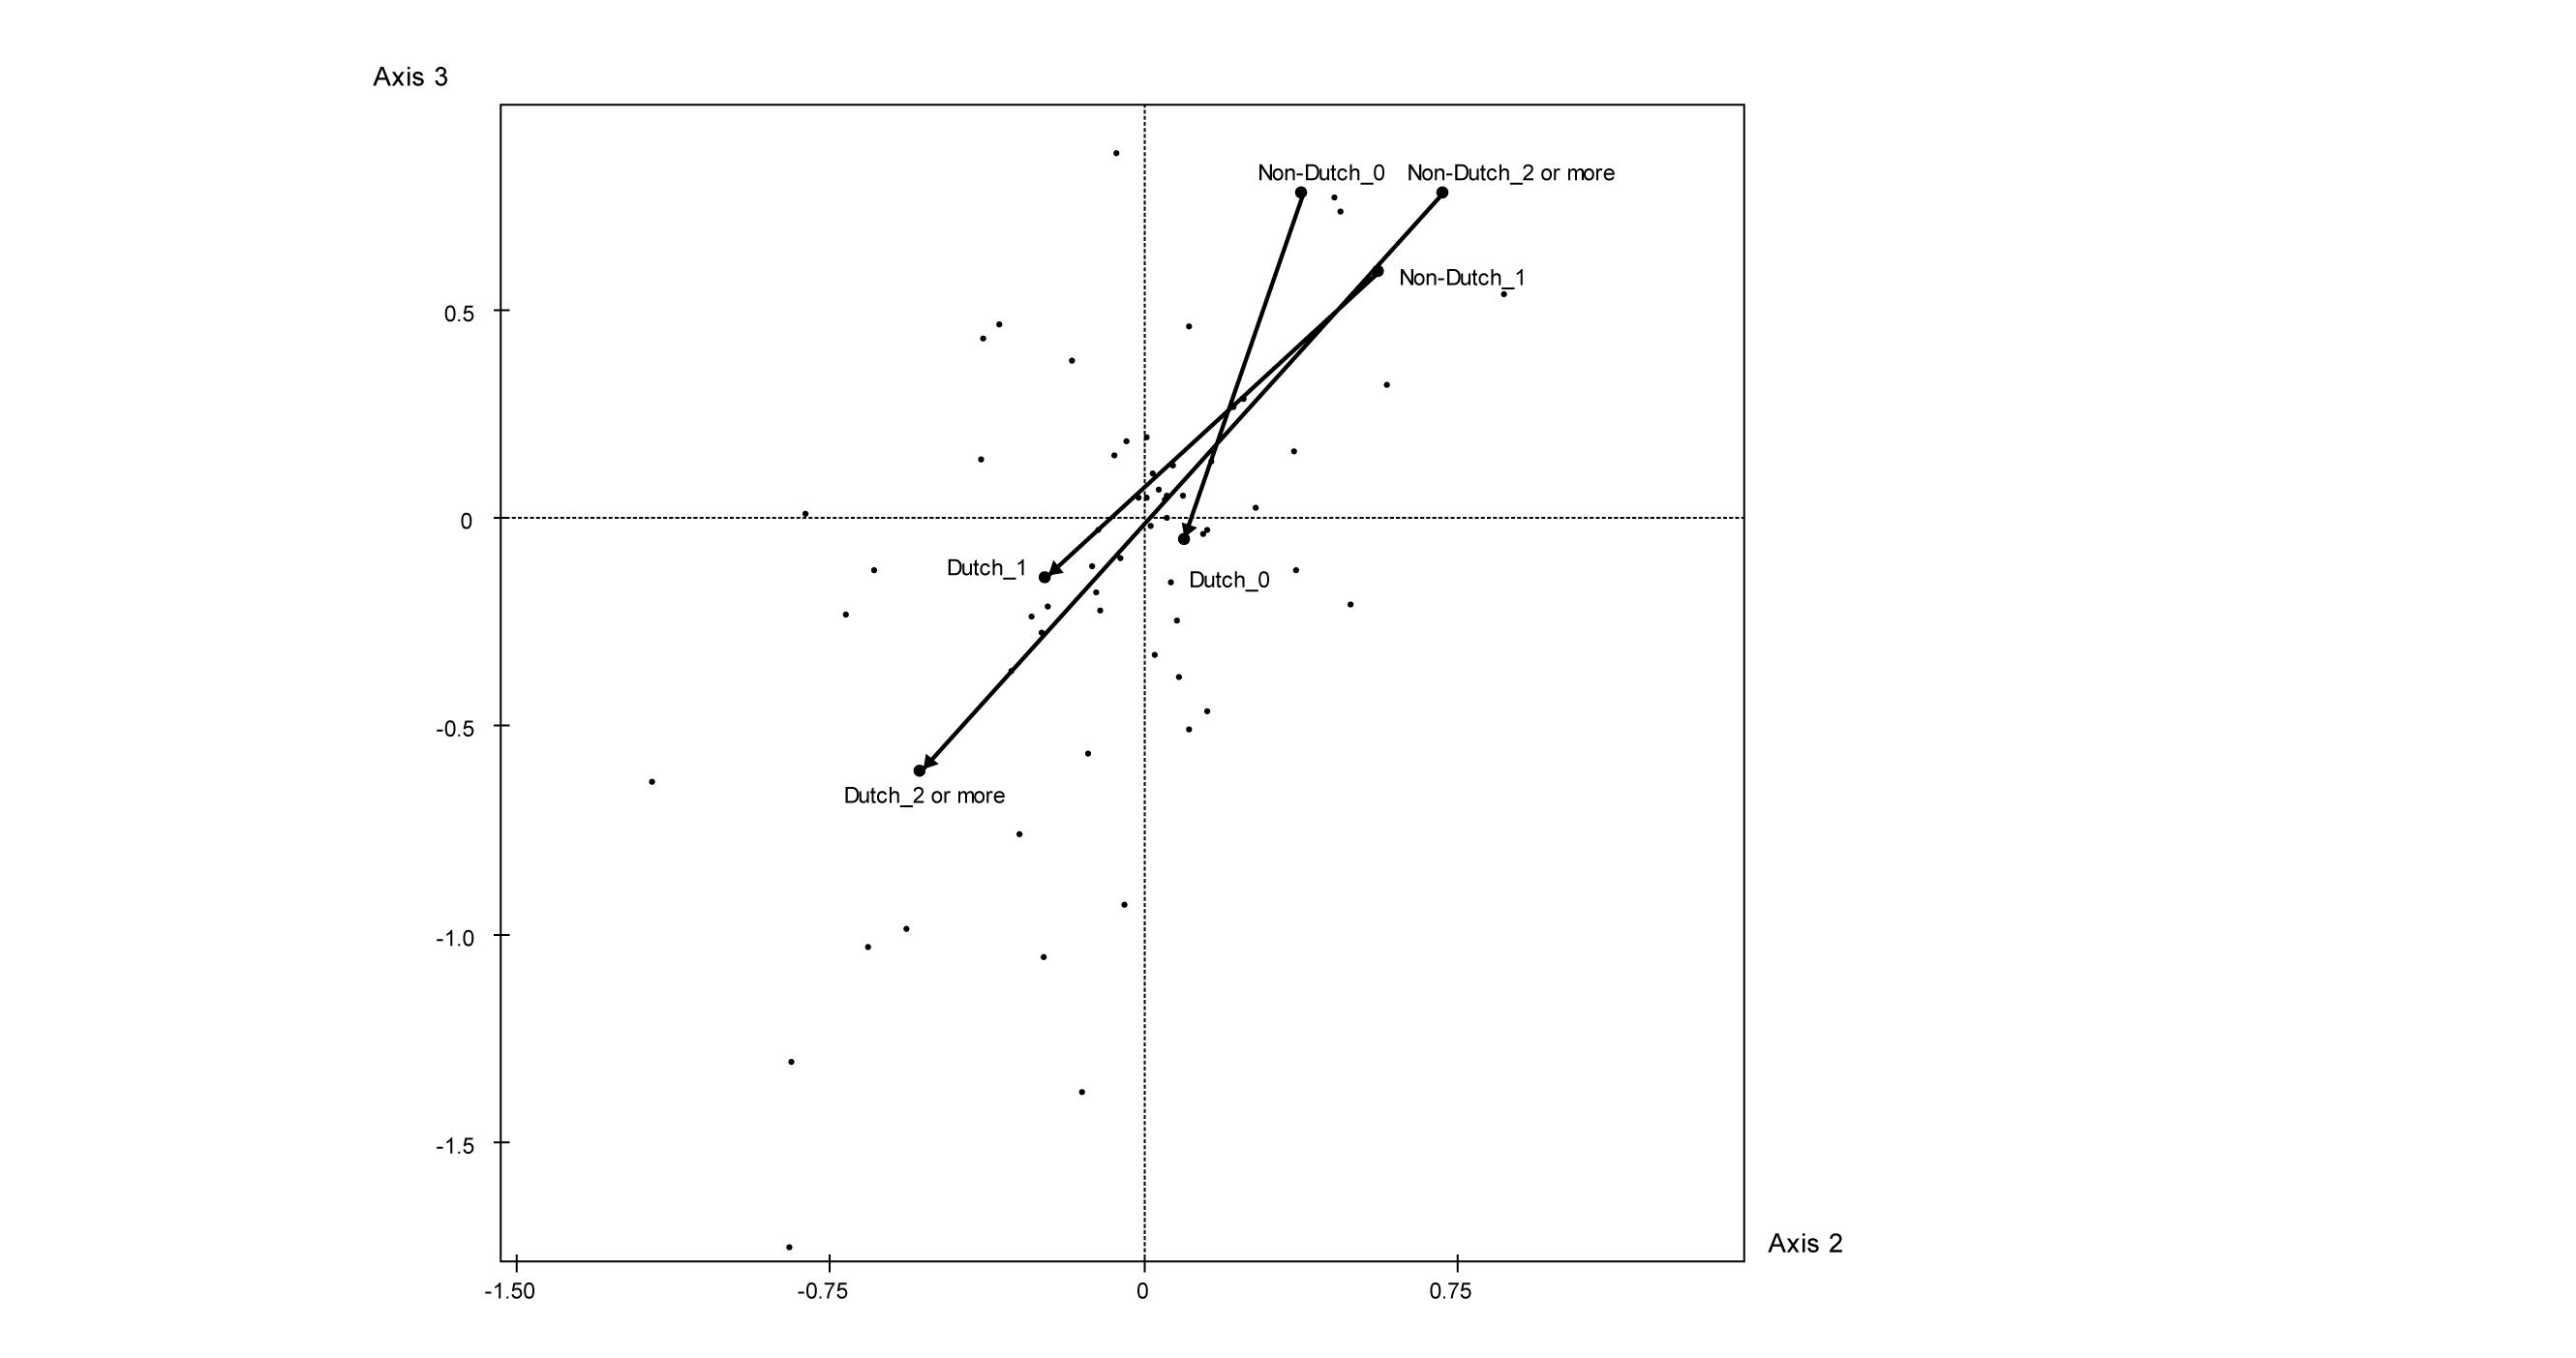
Figure 6.7c
Vectors displaying the effect of nationality within the number of directorates held in the space of modalities, plane of axes 2 and 3.
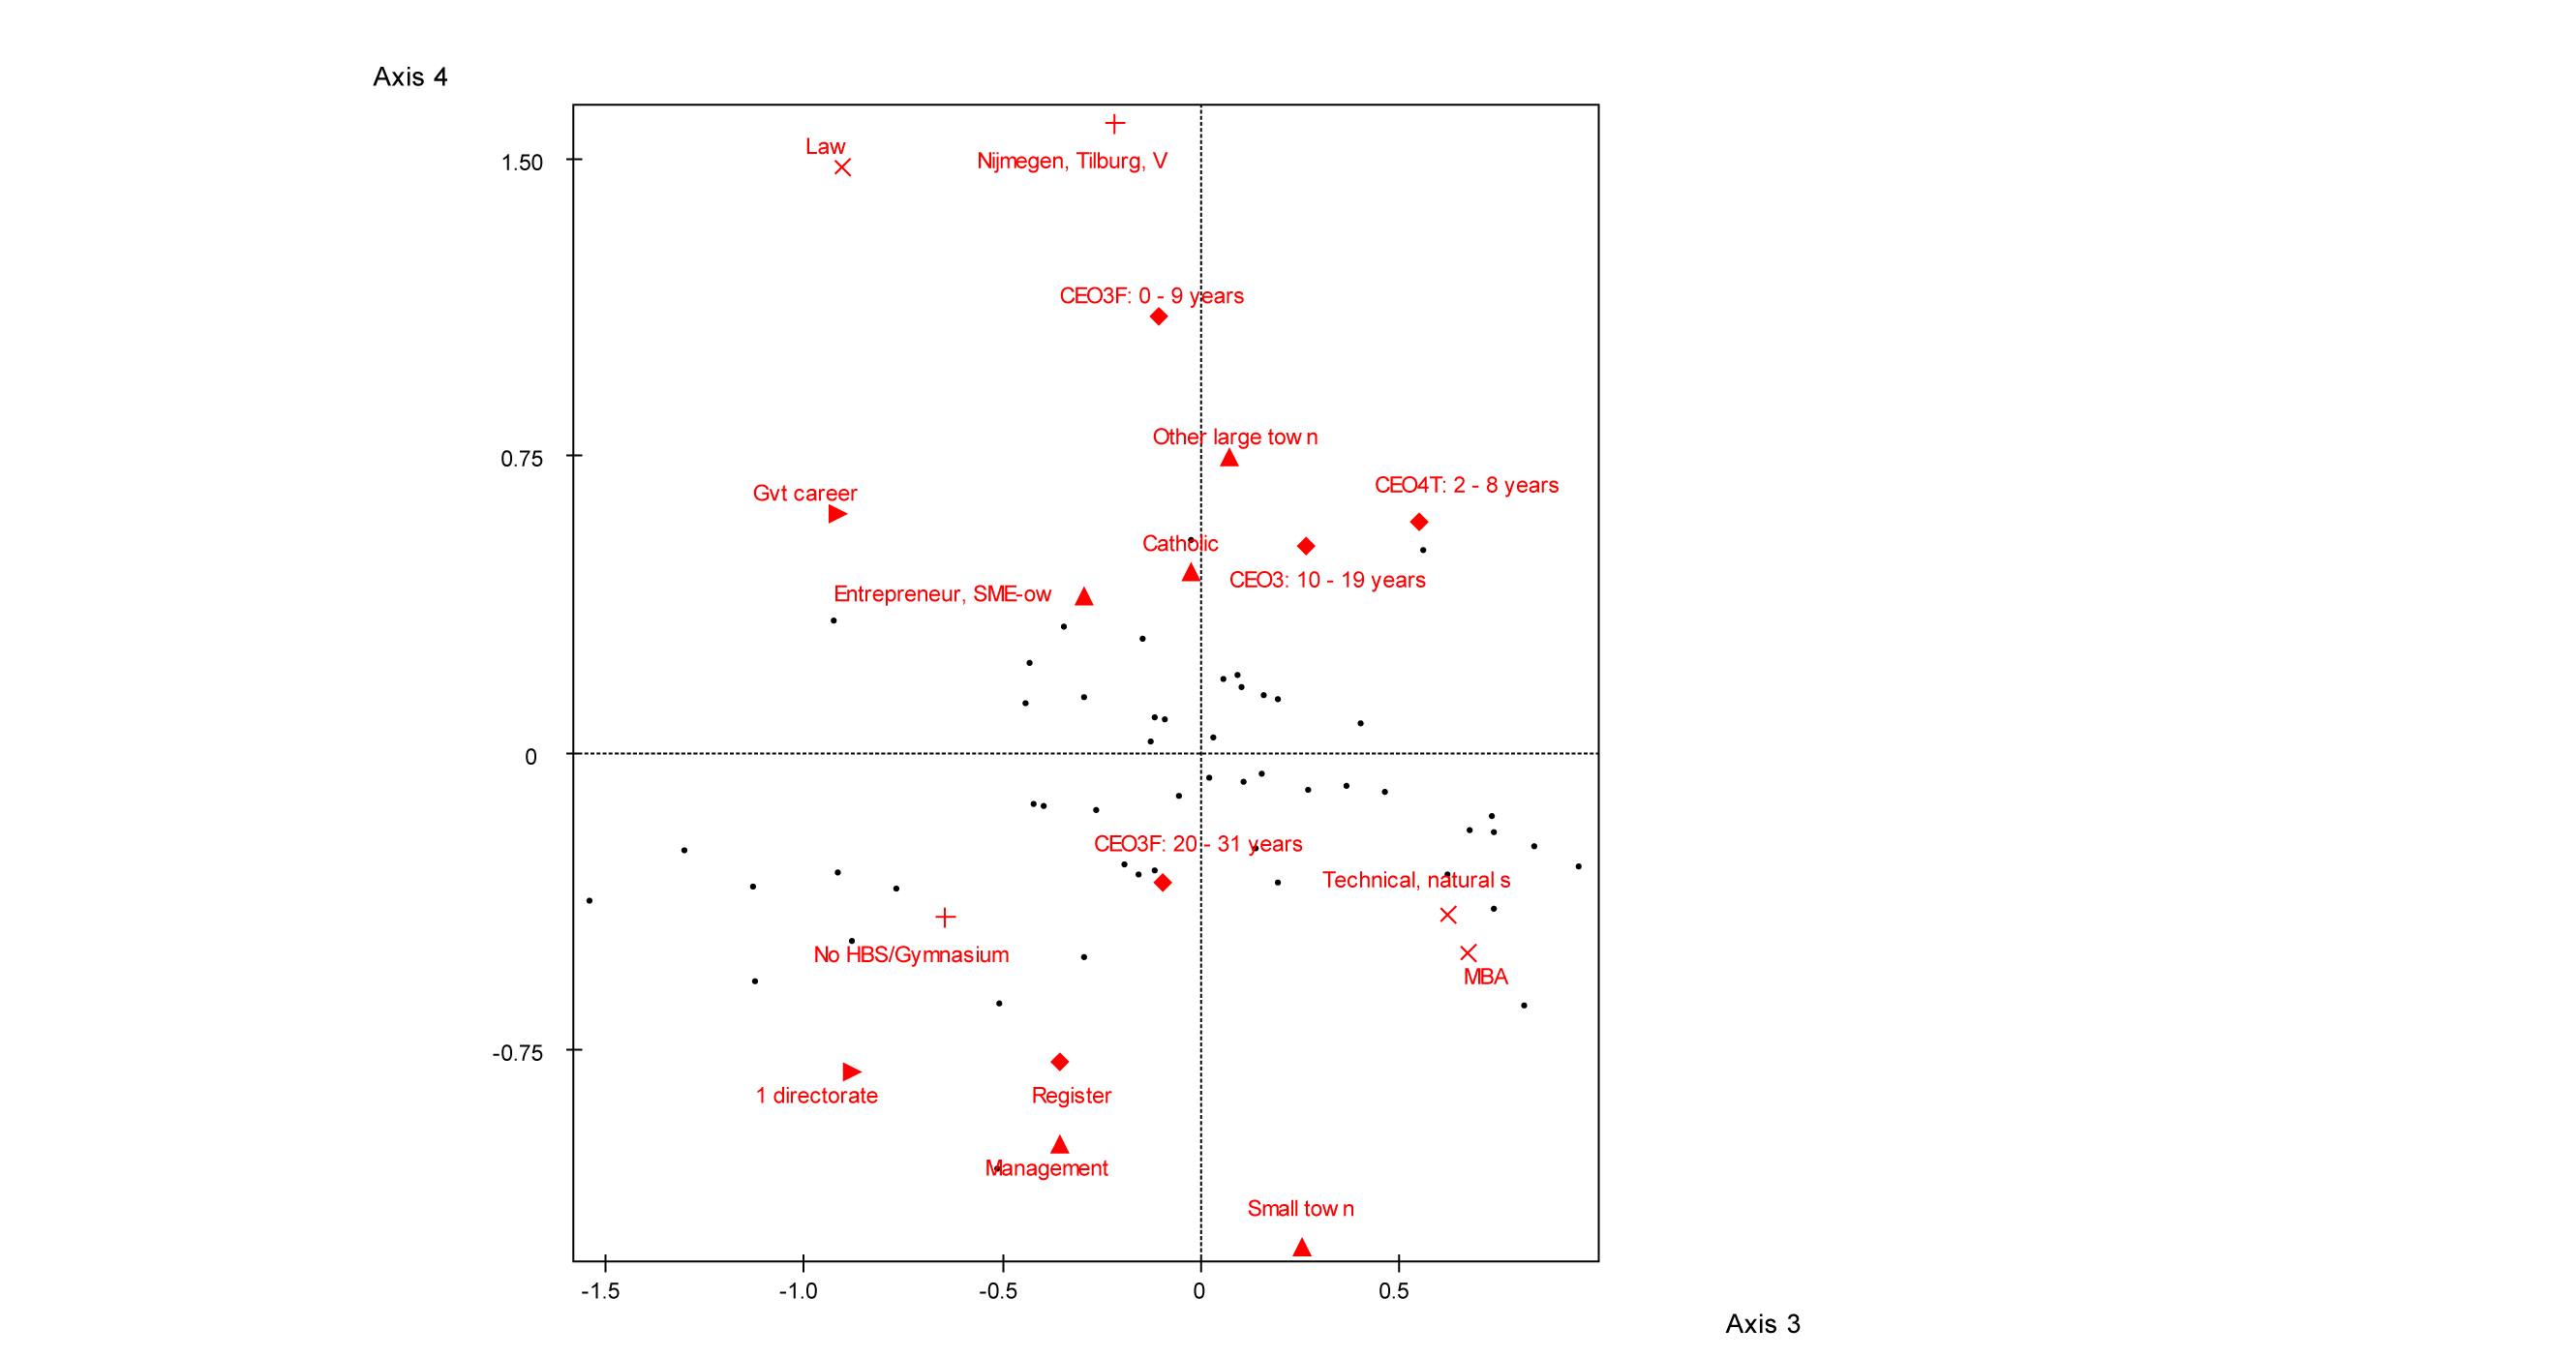
Figure 6.8
Plane of axes 3 and 4.Only the modalities with an above average contribution to axis 4 are shown.
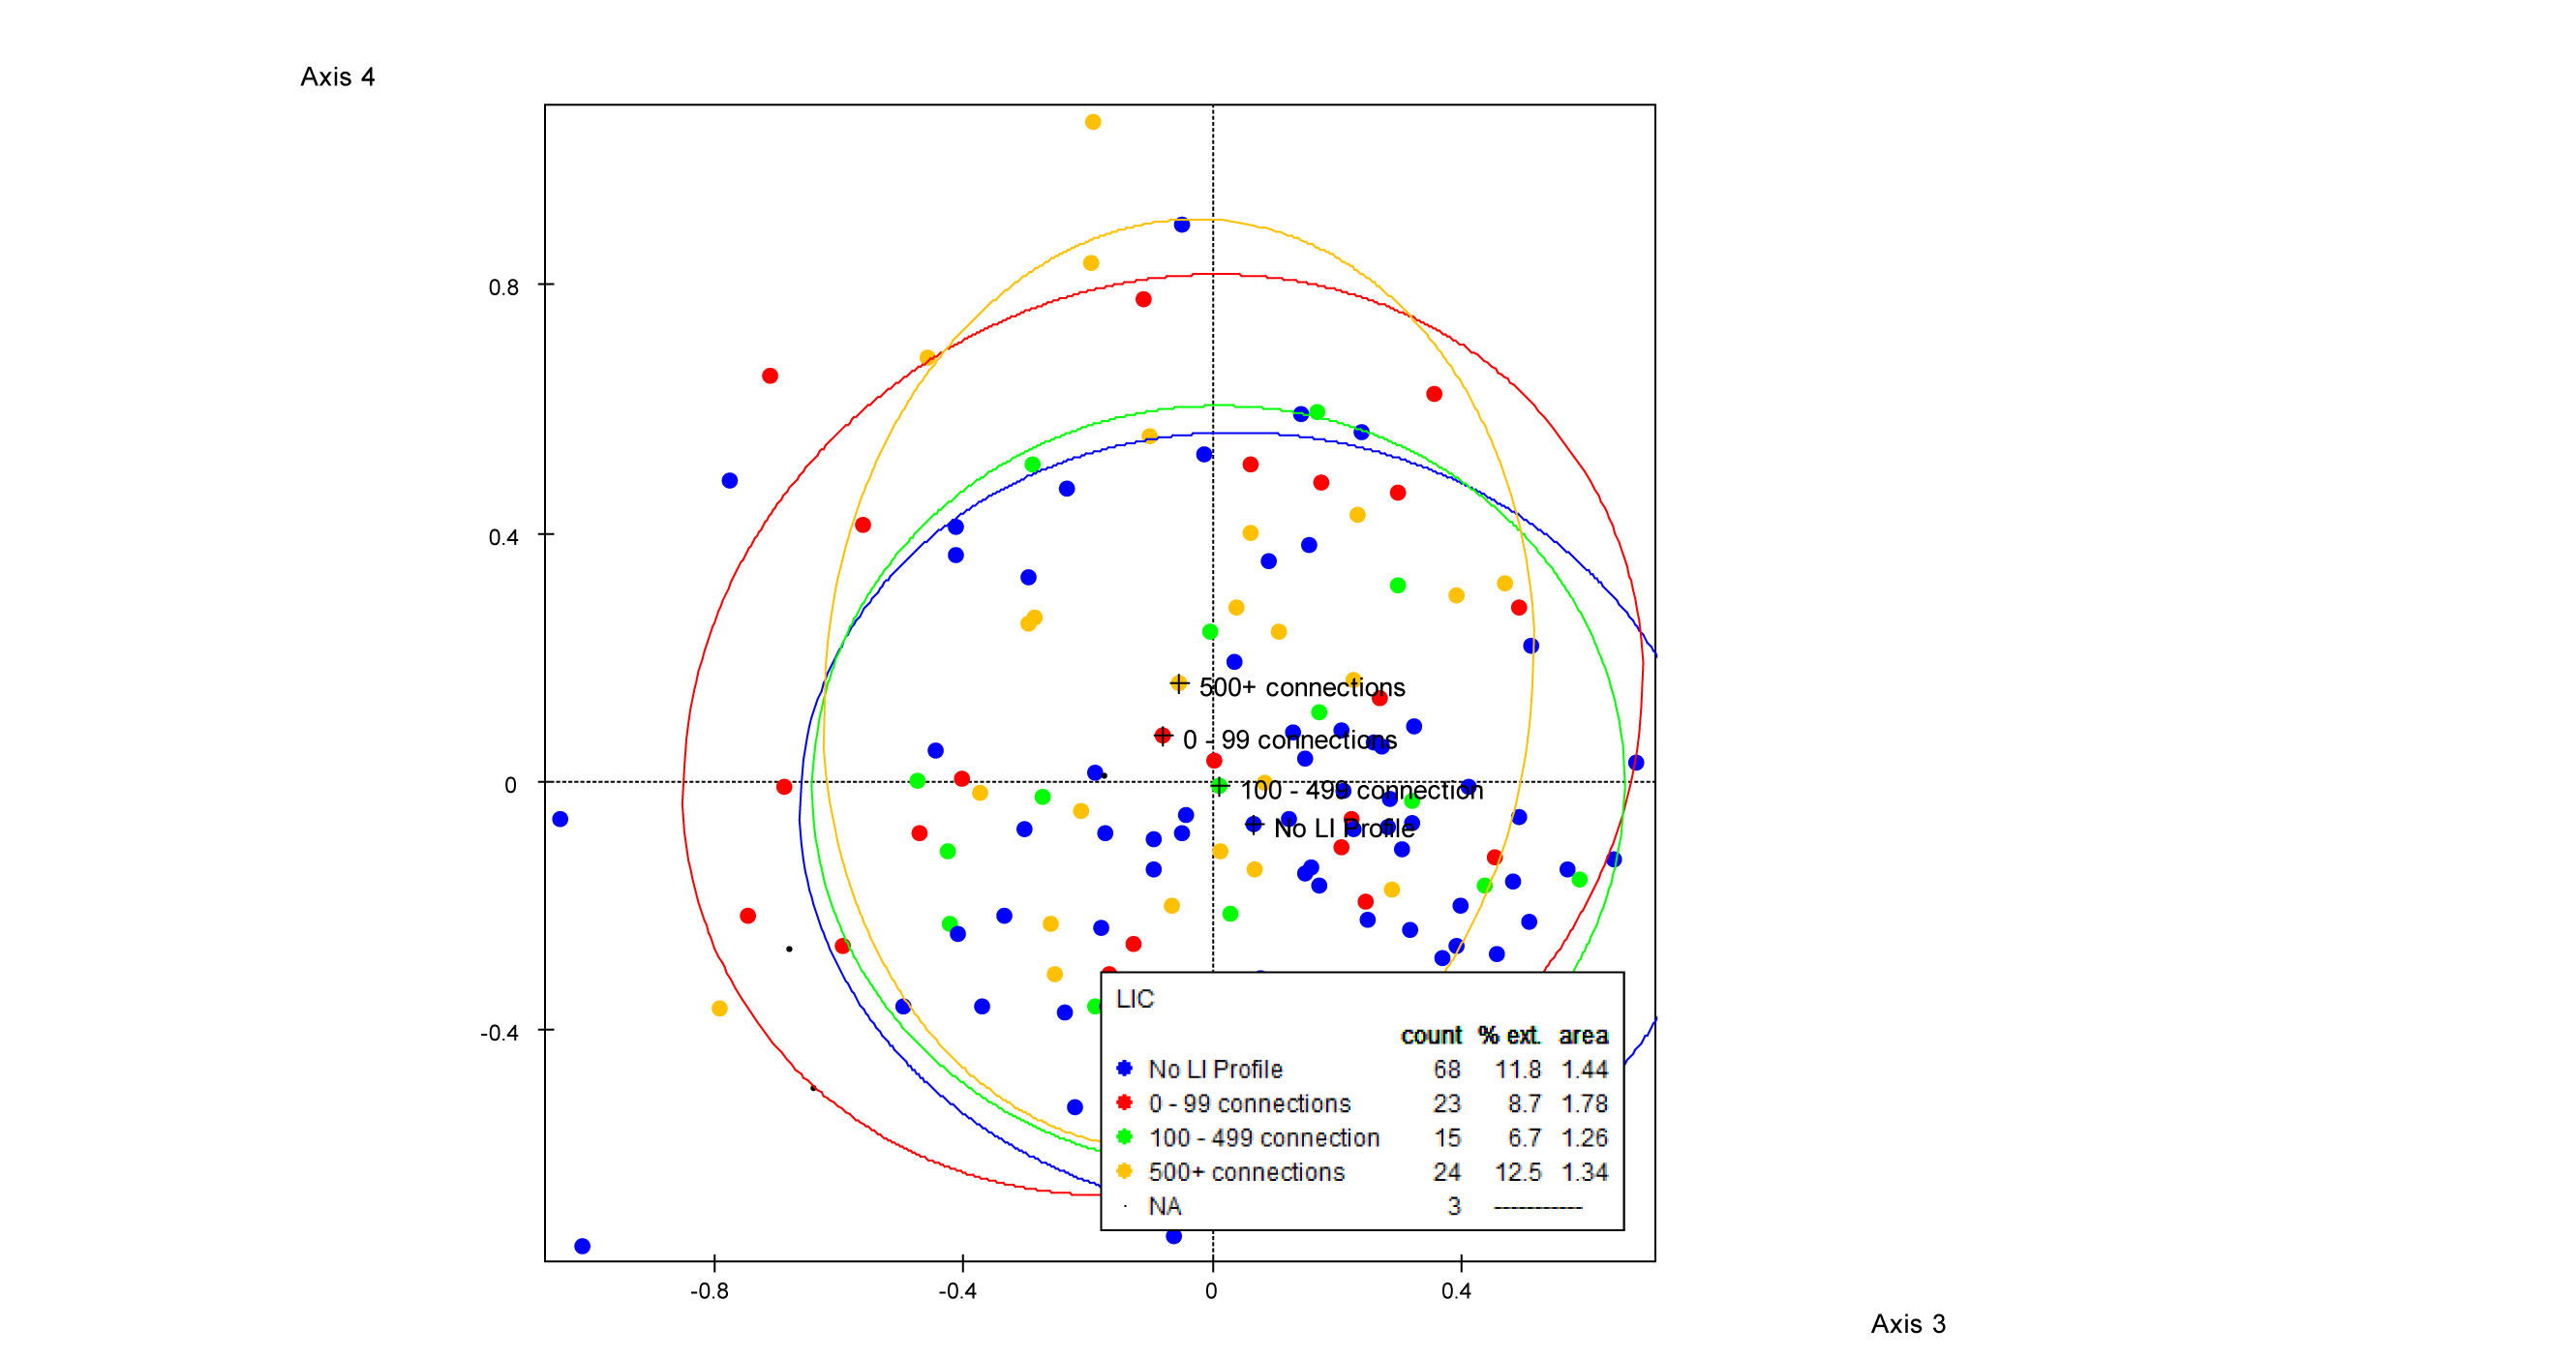
Figure 6.9
Concentration ellipses of the CEOs according to LinkedIn profile. Plane of axes 3 and 4.
Note that information on the profiles was collected in 2014, so the analysis does not pertain to the situation in 2009. The analysis only serves to illustrate differences in the public profile of the CEOs.
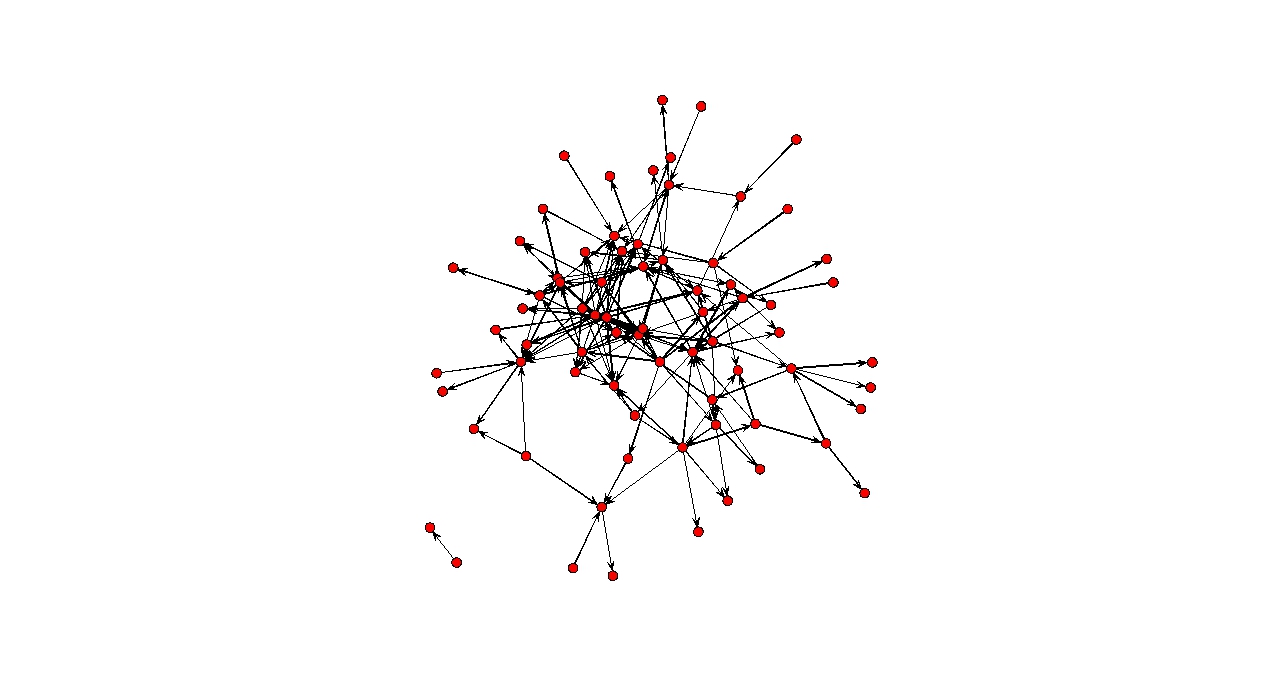
Figure 6.10
Visualisation of the network of the directed links of the CEOs with each other. All links formed after 1-1-2009. Isolates are not represented in this picture.
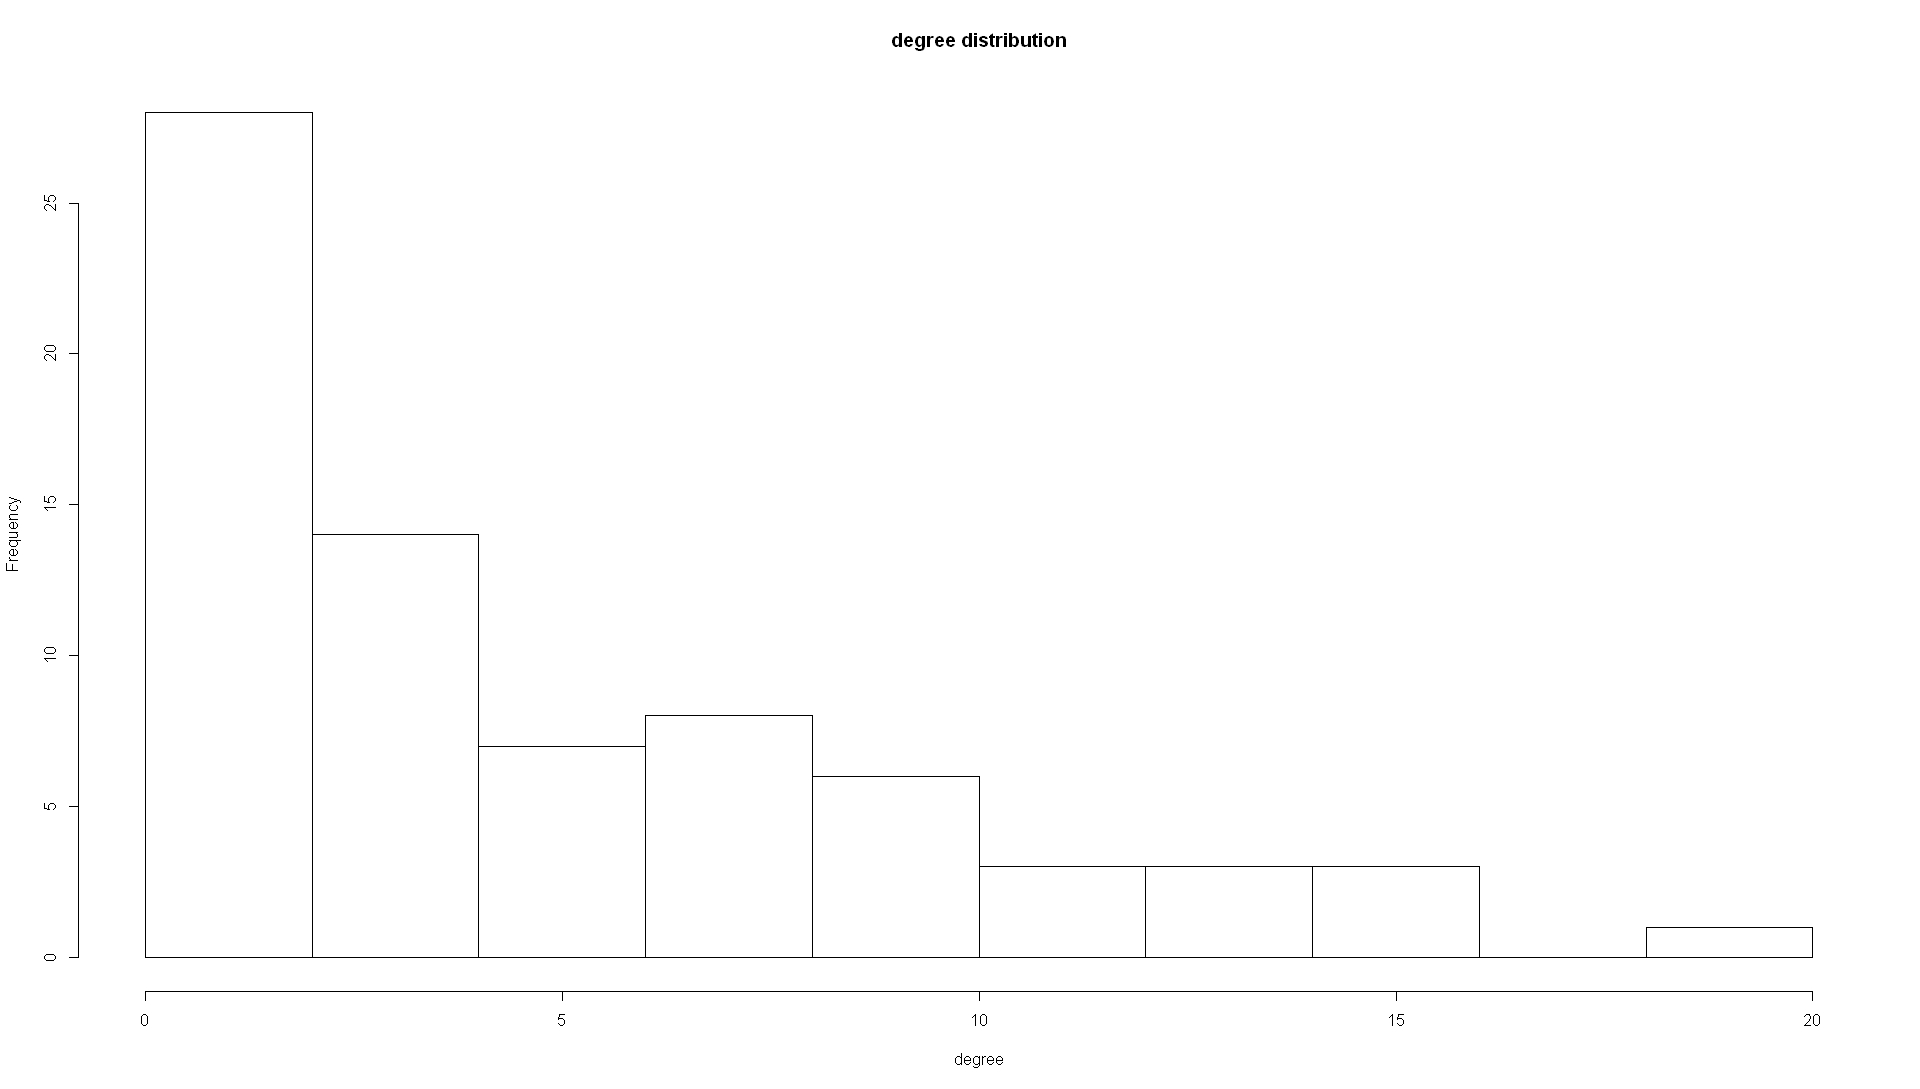
Figure 6.11
Degree distribution of the network of the directed links of the CEO’s with each other.