Click the images for a larger view.
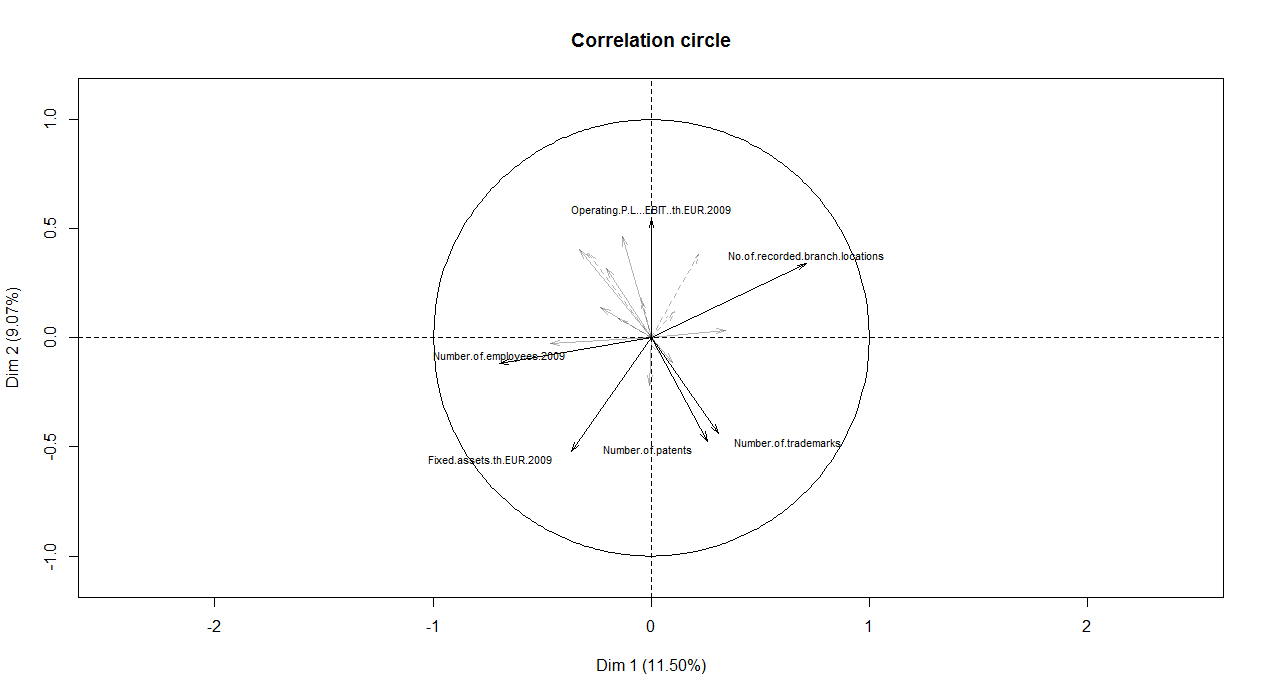
Figure 7.1
Correlation circle of the FAMD analysis of the foreign subsidiaries among the Top 107 firms, current selection.
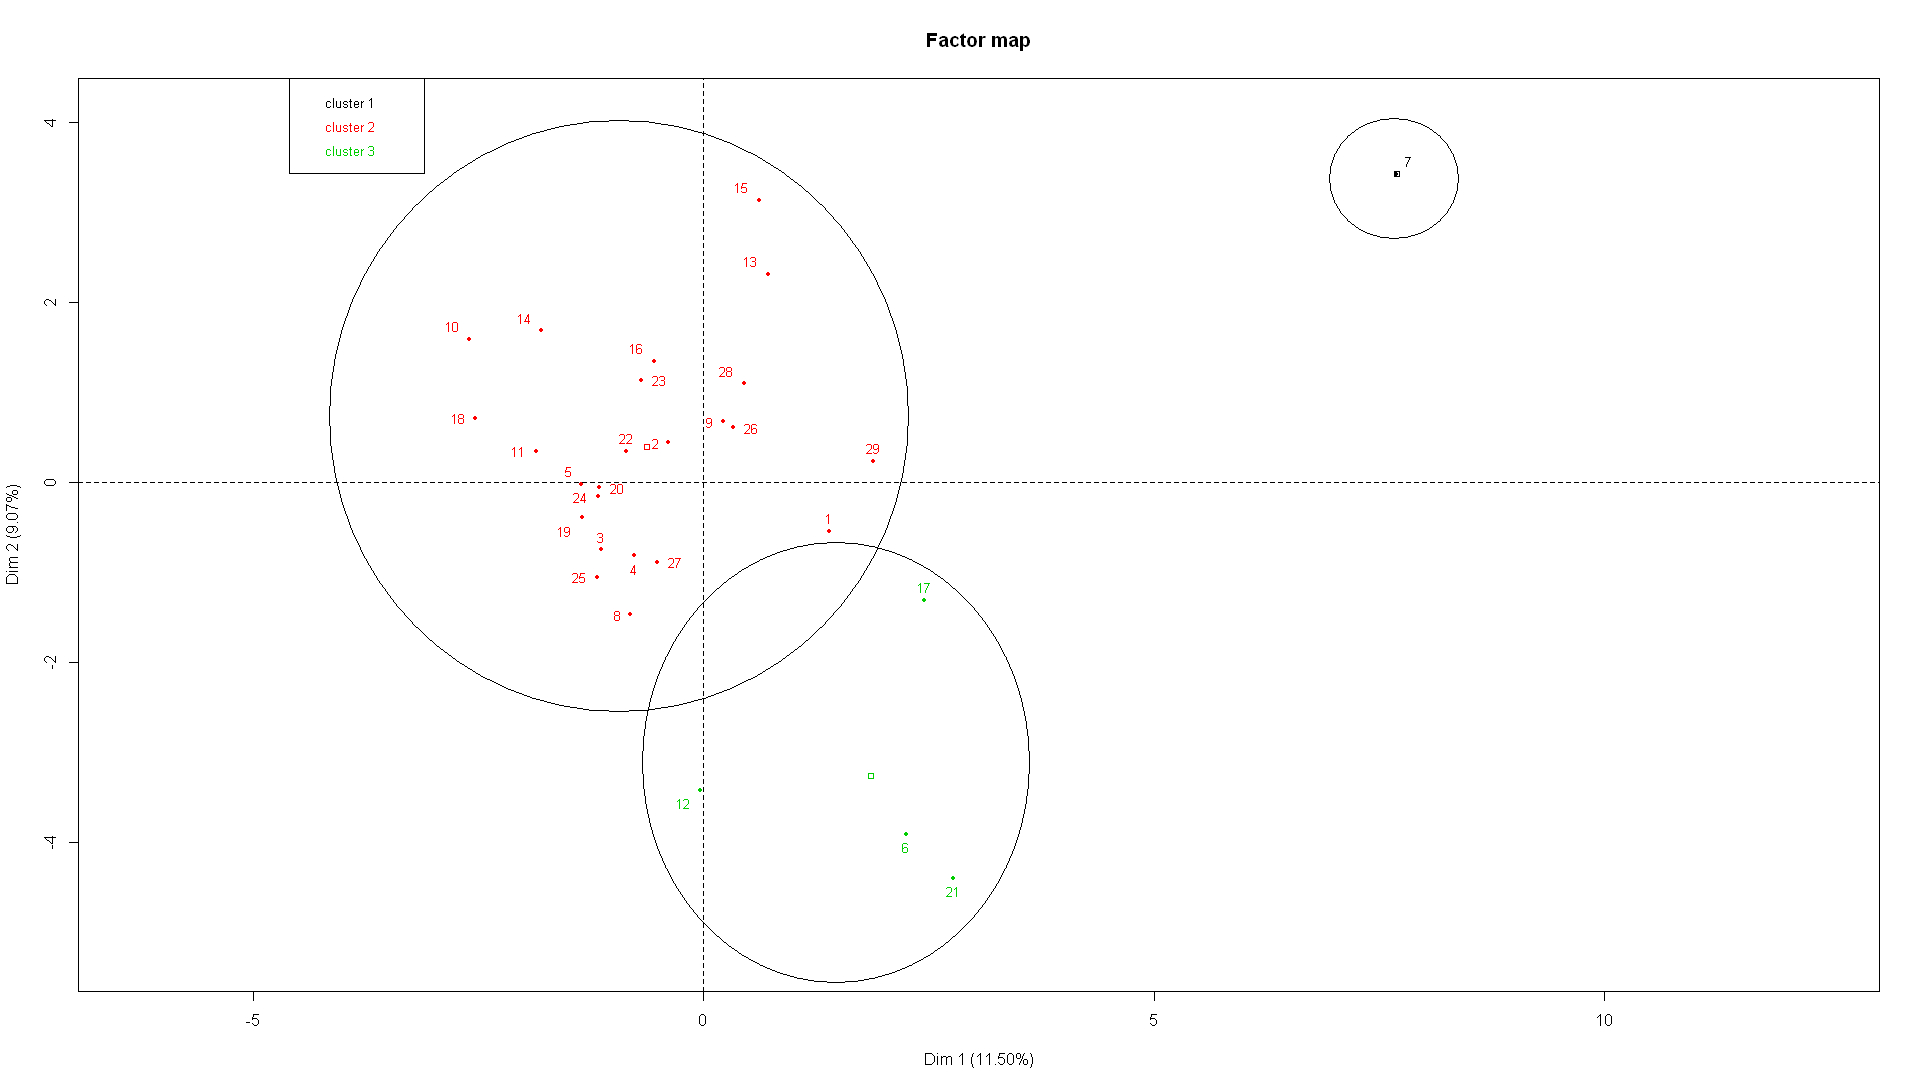
Figure 7.2
Clustering of the results of the FAMD analysis of the foreign subsidiaries among the Top 107 firms, current selection. Circles are drawn to indicate the clusters and to aid visual interpretation only.
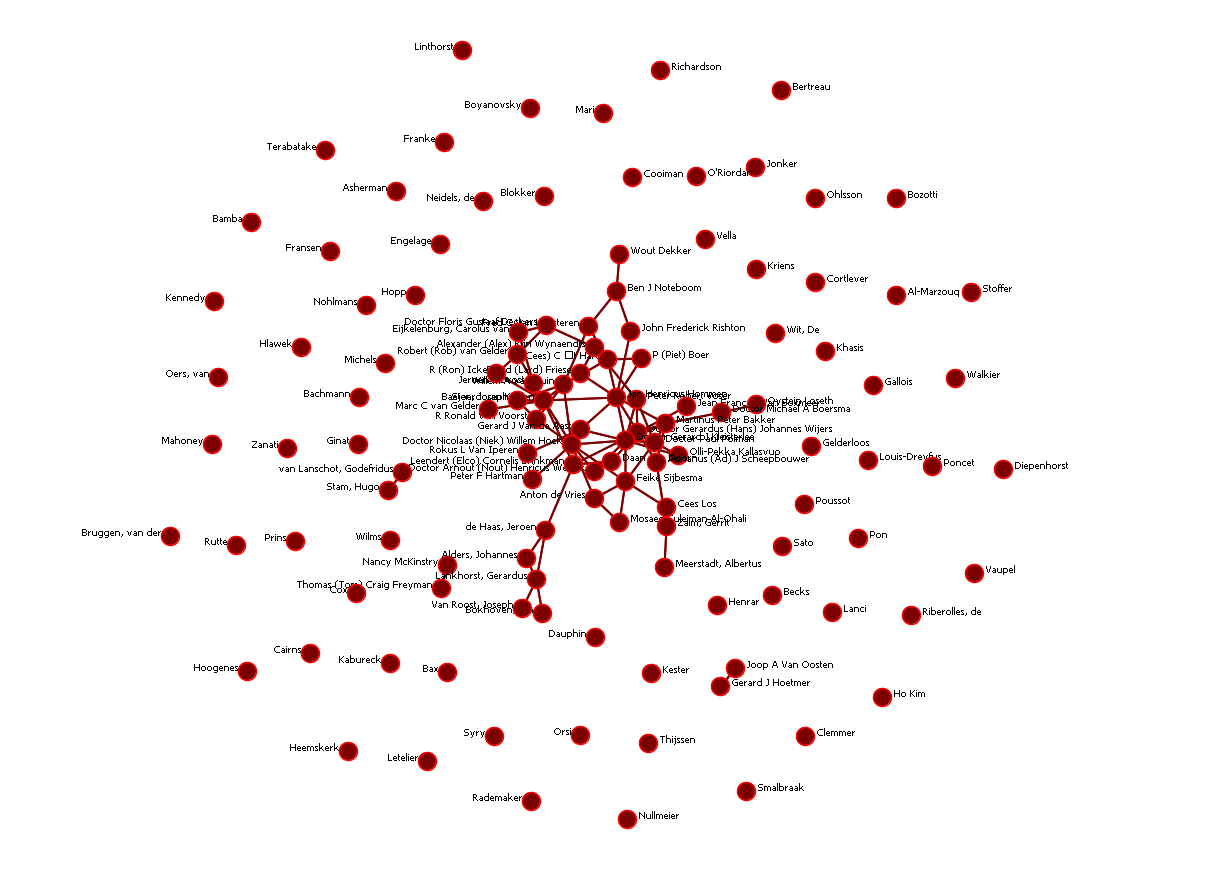
Figure 7.3
Network of the CEOs of the Top 107 firms, current selection. Ties are based on an overlap in time (≥ 1 year) at the same organization in an equivalent position.