Chapter 4: Comining Methods: Studying the Mixed Methods Research Approach

Click the images for a larger view.

Figure 4.1 Google NGram viewer search for quantitative data and qualitative data (see footnote 51).


Figure 4.1
Google NGram viewer search for quantitative data and qualitative data (see footnote 51).


Figure 4.2 Percentage of the total of Mixed Methods articles appearing in a given year, 1990 - 2012 (yearly values sum to 1). See Footnote 52.

Figure 4.2
Percentage of the total of Mixed Methods articles appearing in a given year, 
1990 – 2012 (yearly values sum to 1). See Footnote 52.


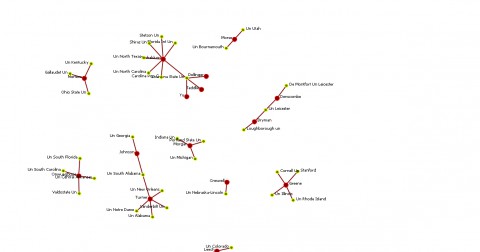
Figure 4.3 Bi-partite network of MMR researchers who have received the most citations of the selected group, based on affiliation with research institute.
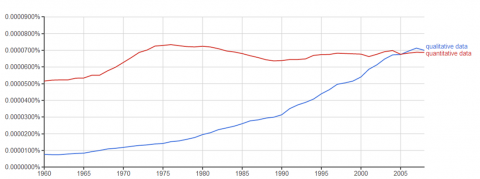
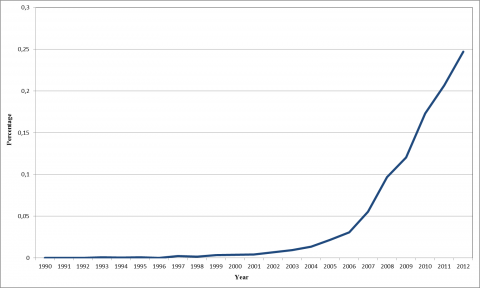
Figure 4.3
Bi-partite network of MMR researchers who have received the most citations of the selected group, based on affiliation with research institute.