Click the images for a larger view.
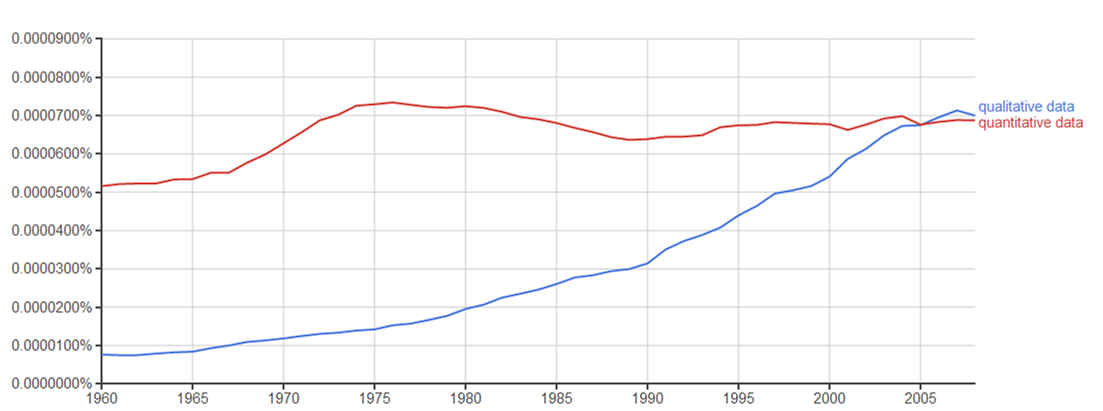
Figure 4.1
Google NGram viewer search for quantitative data and qualitative data (see footnote 51).
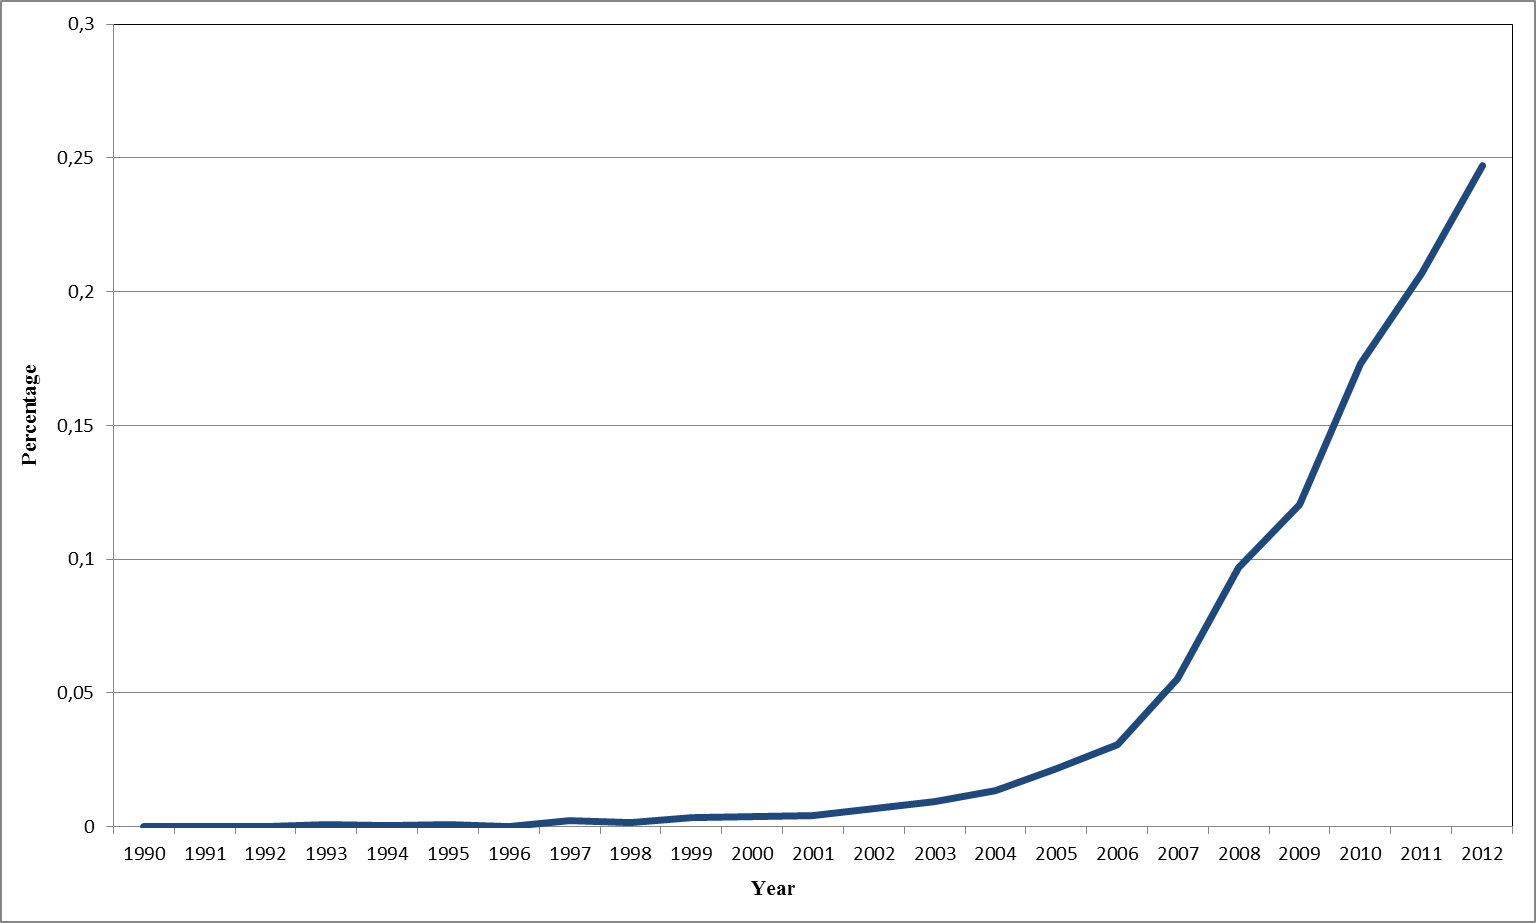
Figure 4.2
Percentage of the total of Mixed Methods articles appearing in a given year, 1990 – 2012 (yearly values sum to 1). See Footnote 52.
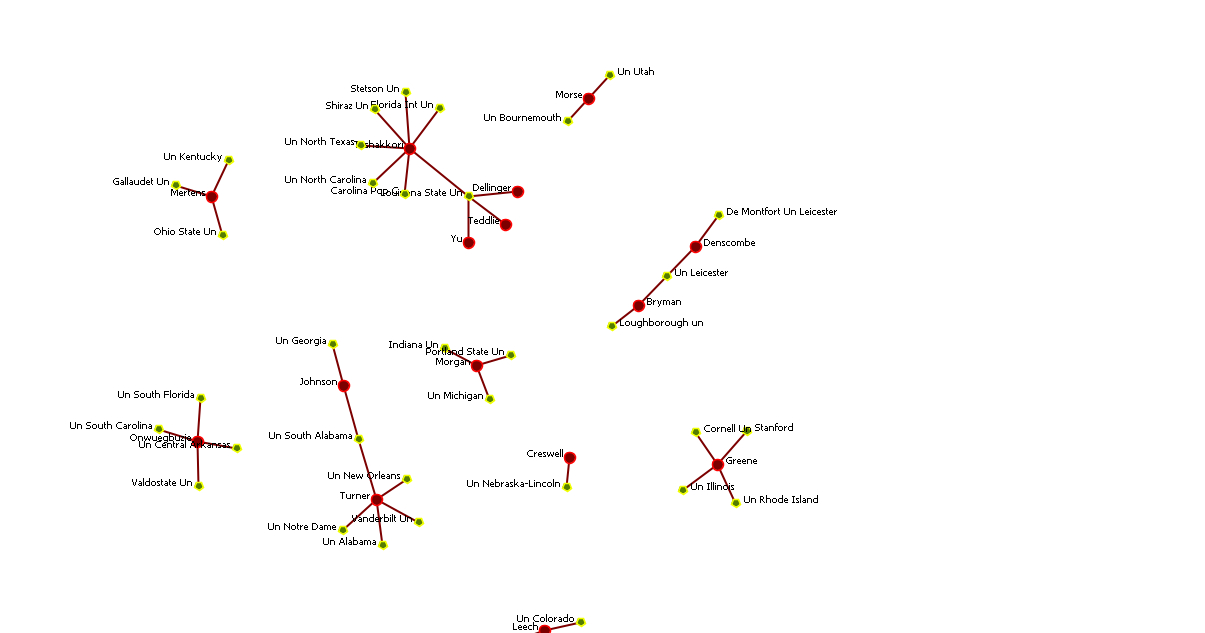
Figure 4.3
Bi-partite network of MMR researchers who have received the most citations of the selected group, based on affiliation with research institute.