Click the images for a larger view.
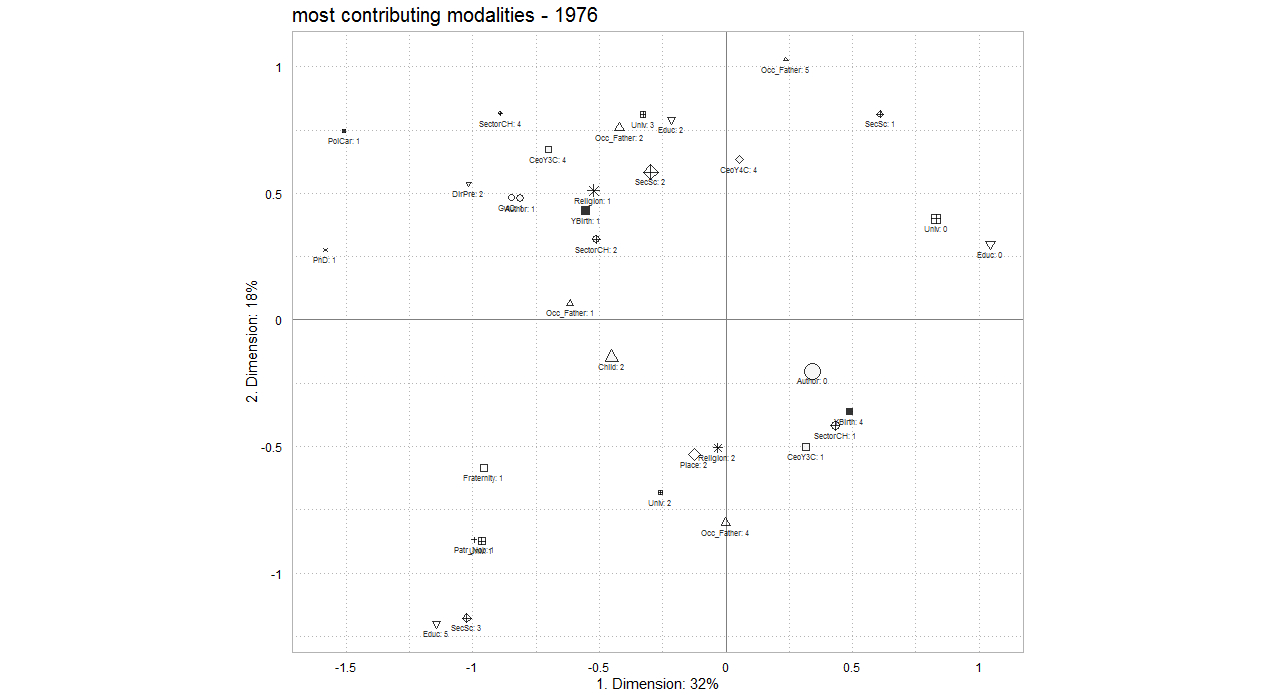
Figure 5.1a
Plane of axes 1 and 2, 1976. Only the modalities with an above average contribution are shown.
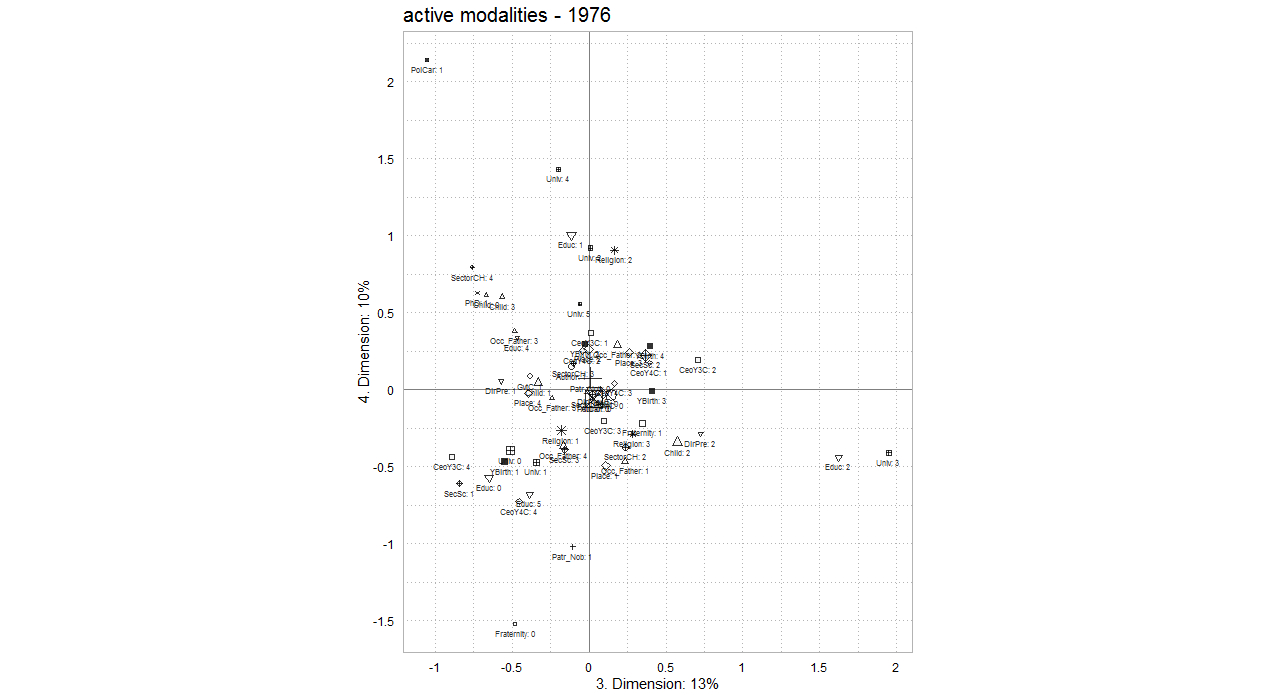
Figure 5.1b
Plane of axes 3 and 4. All active modalities are shown.
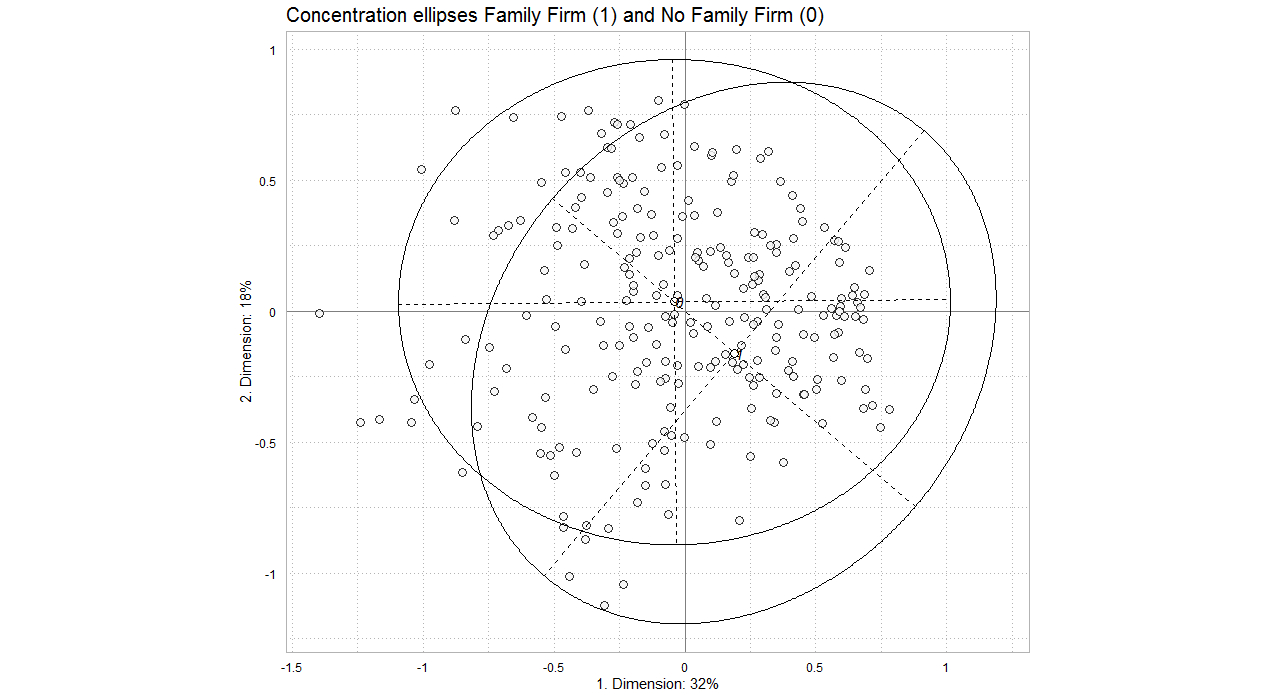
Figure 5.2
Concentration ellipses of the 1976 CEOs of family firms (1) and no family firms (0) in the plane of axes 1 and 2.
Figure 5.3a
Number of sector changes of individuals in 1976 in the plane of axes 3 and 4. 1=lowest amount of changes, 4=highest.
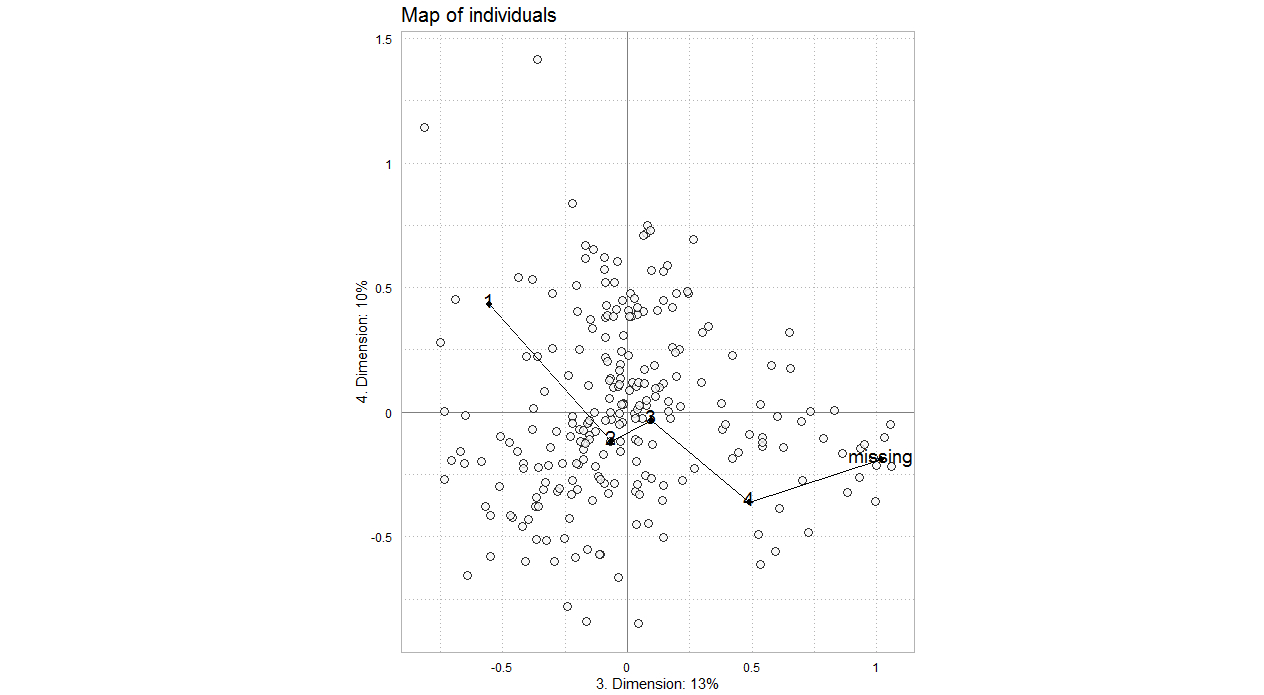
Figure 5.3b
Birth cohorts of individuals in 1976 in the plane of axes 3 and 4. 1=oldest cohort, 4=youngest cohort.
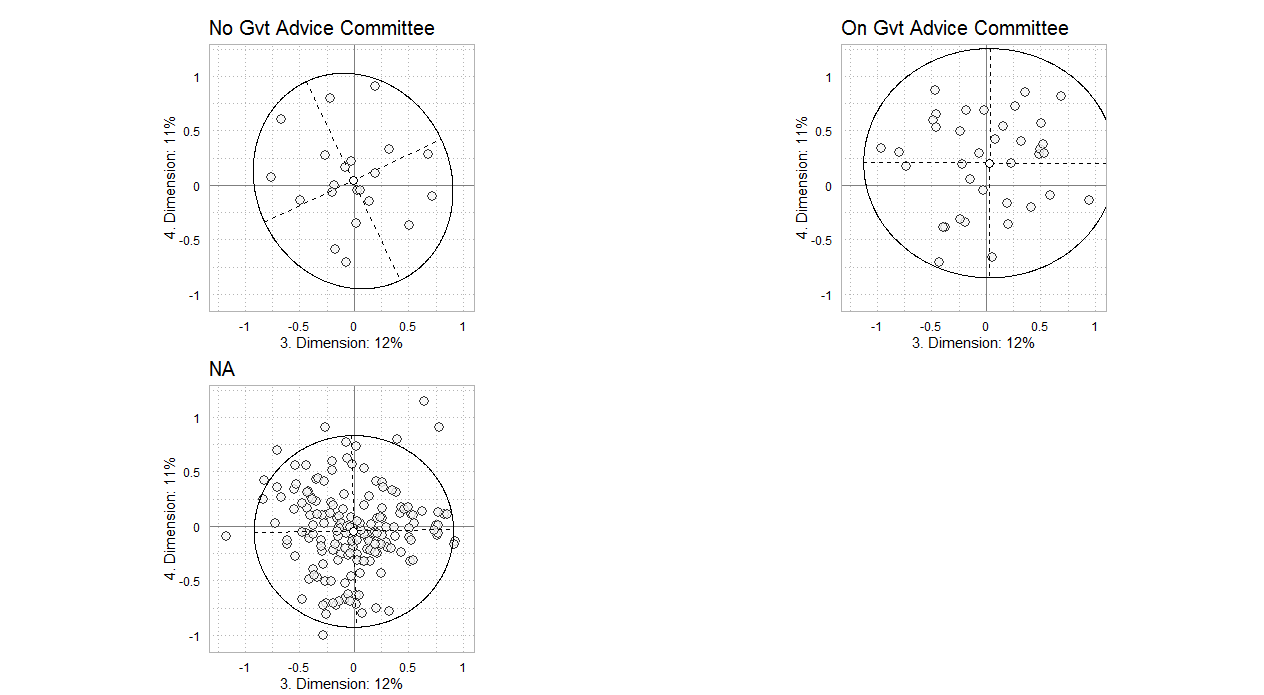
Figure 5.4a
Subclouds of individuals based on membership of a governmental advice committee in 1976 in the plane of axes 3 and 4.
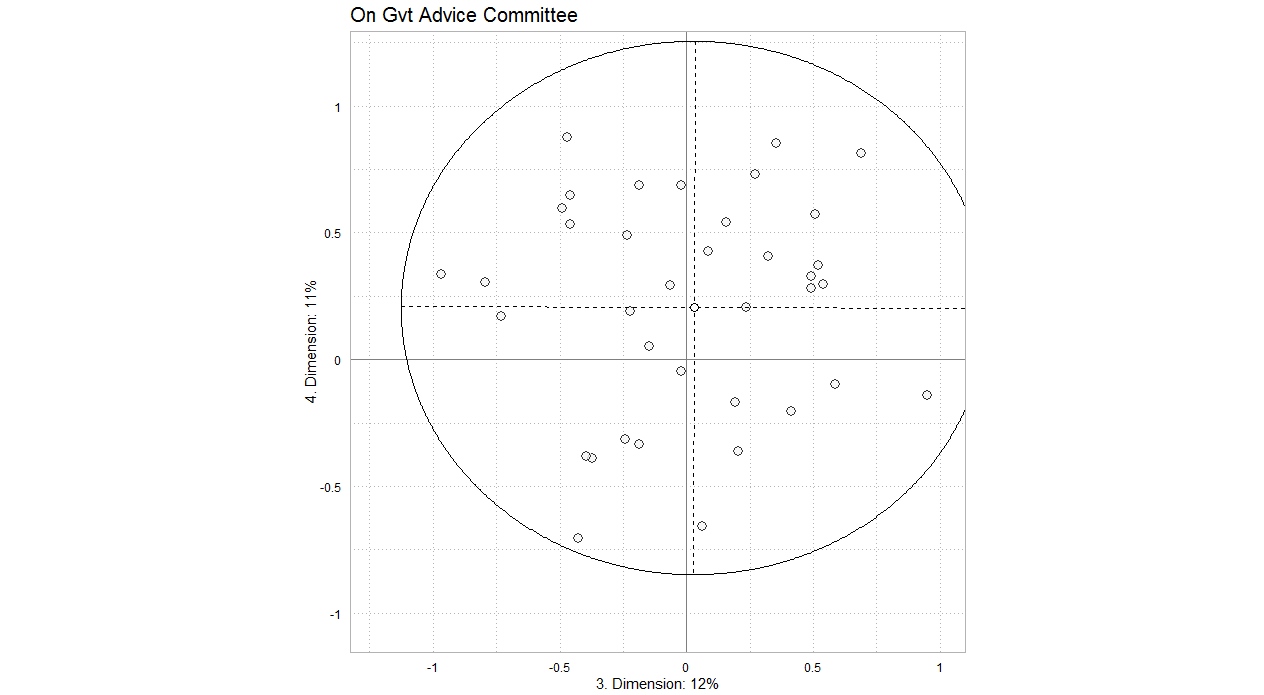
Figure 5.4b
Subcloud of individuals who were members of a governmental advisory committee in 1976 in the plane of axes 3 and 4.
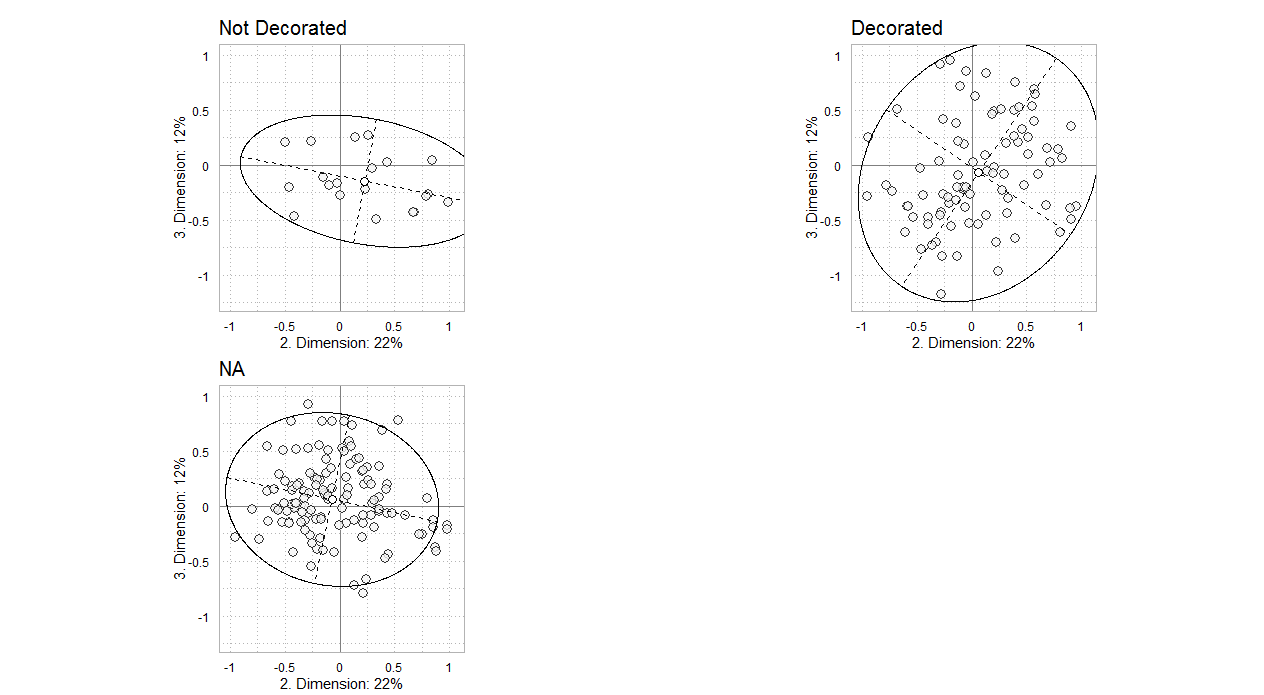
Figure 5.5
Subclouds of individuals based on having received a decoration in or before 1976 in the plane of axes 2 and 3.
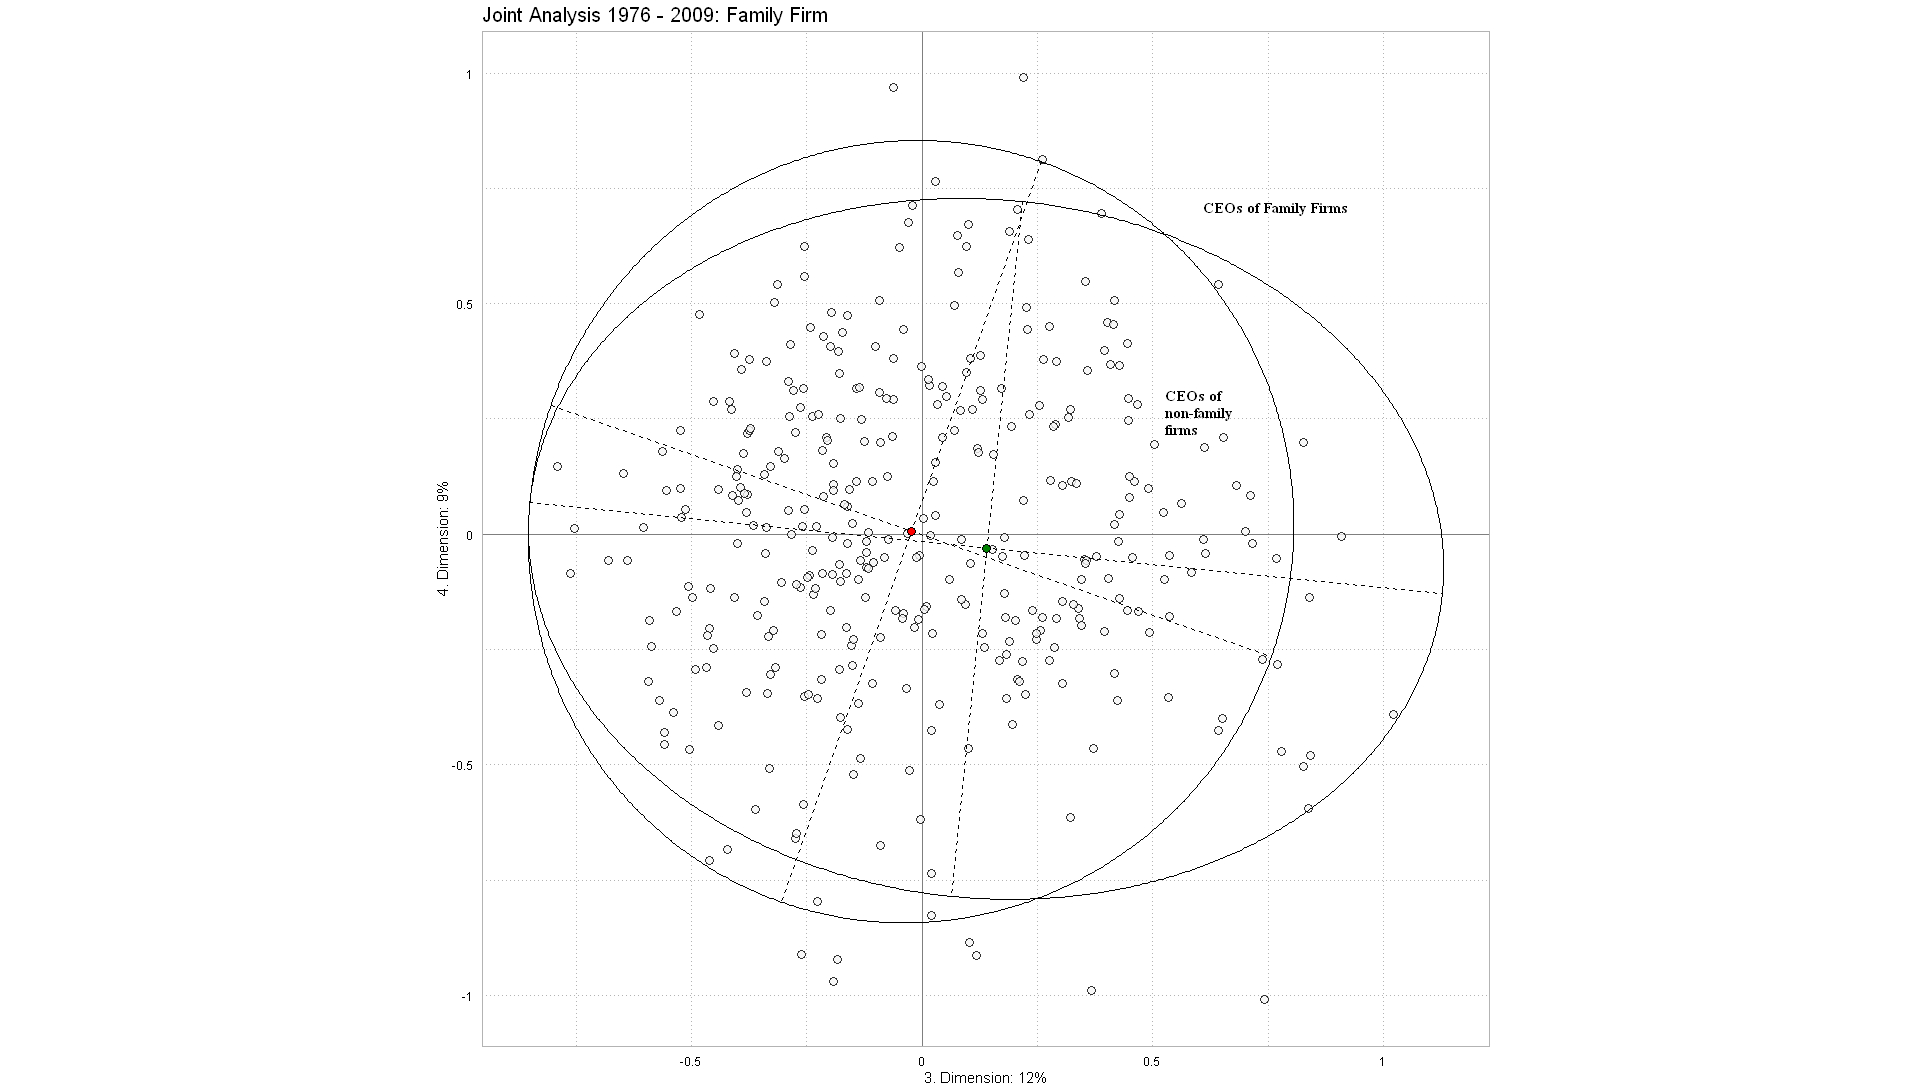
Figure 5.6
Concentration ellipses of the Family Firm CEOs in the plane of axes 3 and 4. Joint analysis of all individuals.
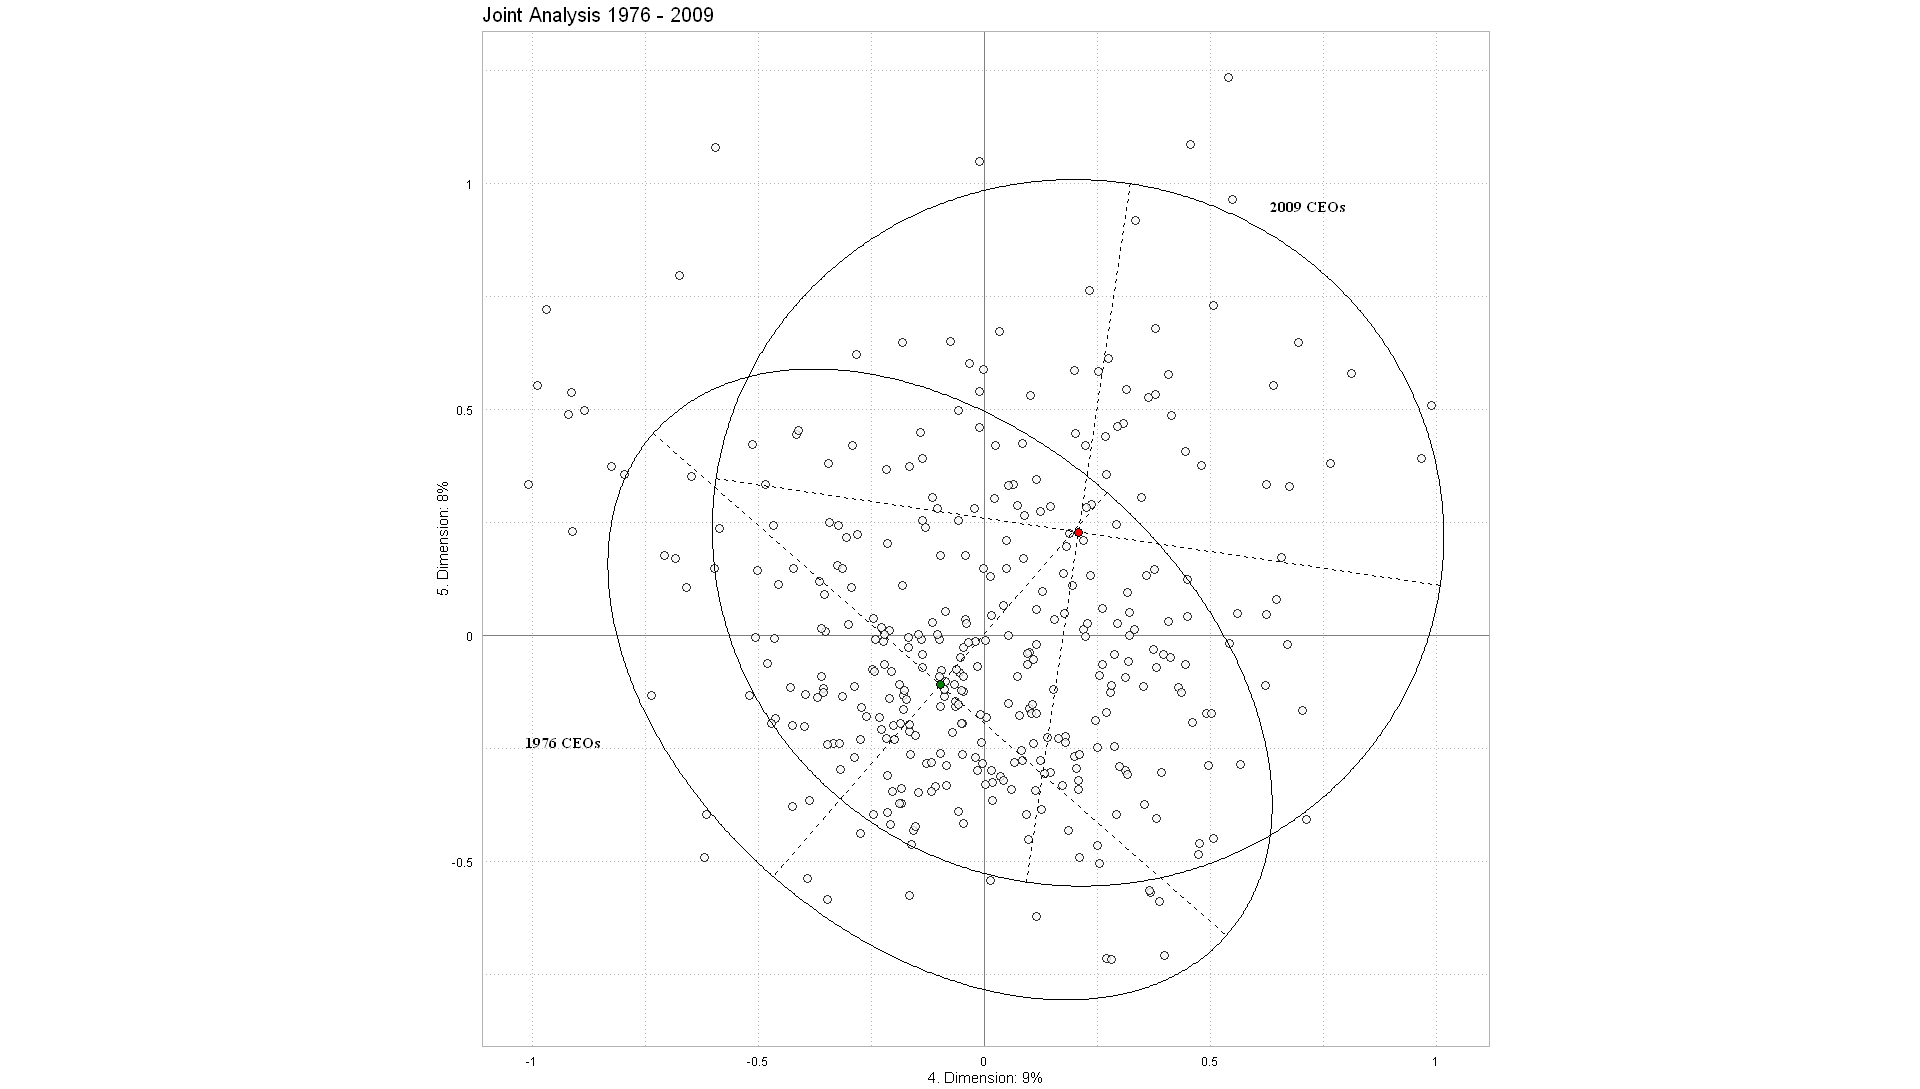
Figure 5.7
Concentration ellipses of the 1976 and 2009 cohorts in the plane of axes 4 and 5. Joint analysis of all individuals.